
Built for funded futures traders
Your trading business, in one place.
Know what you spent on evaluations and what came back in payouts. Set your own rules and entry checklist, and see how many days you actually kept them. Write your journal next to your trades and charts.
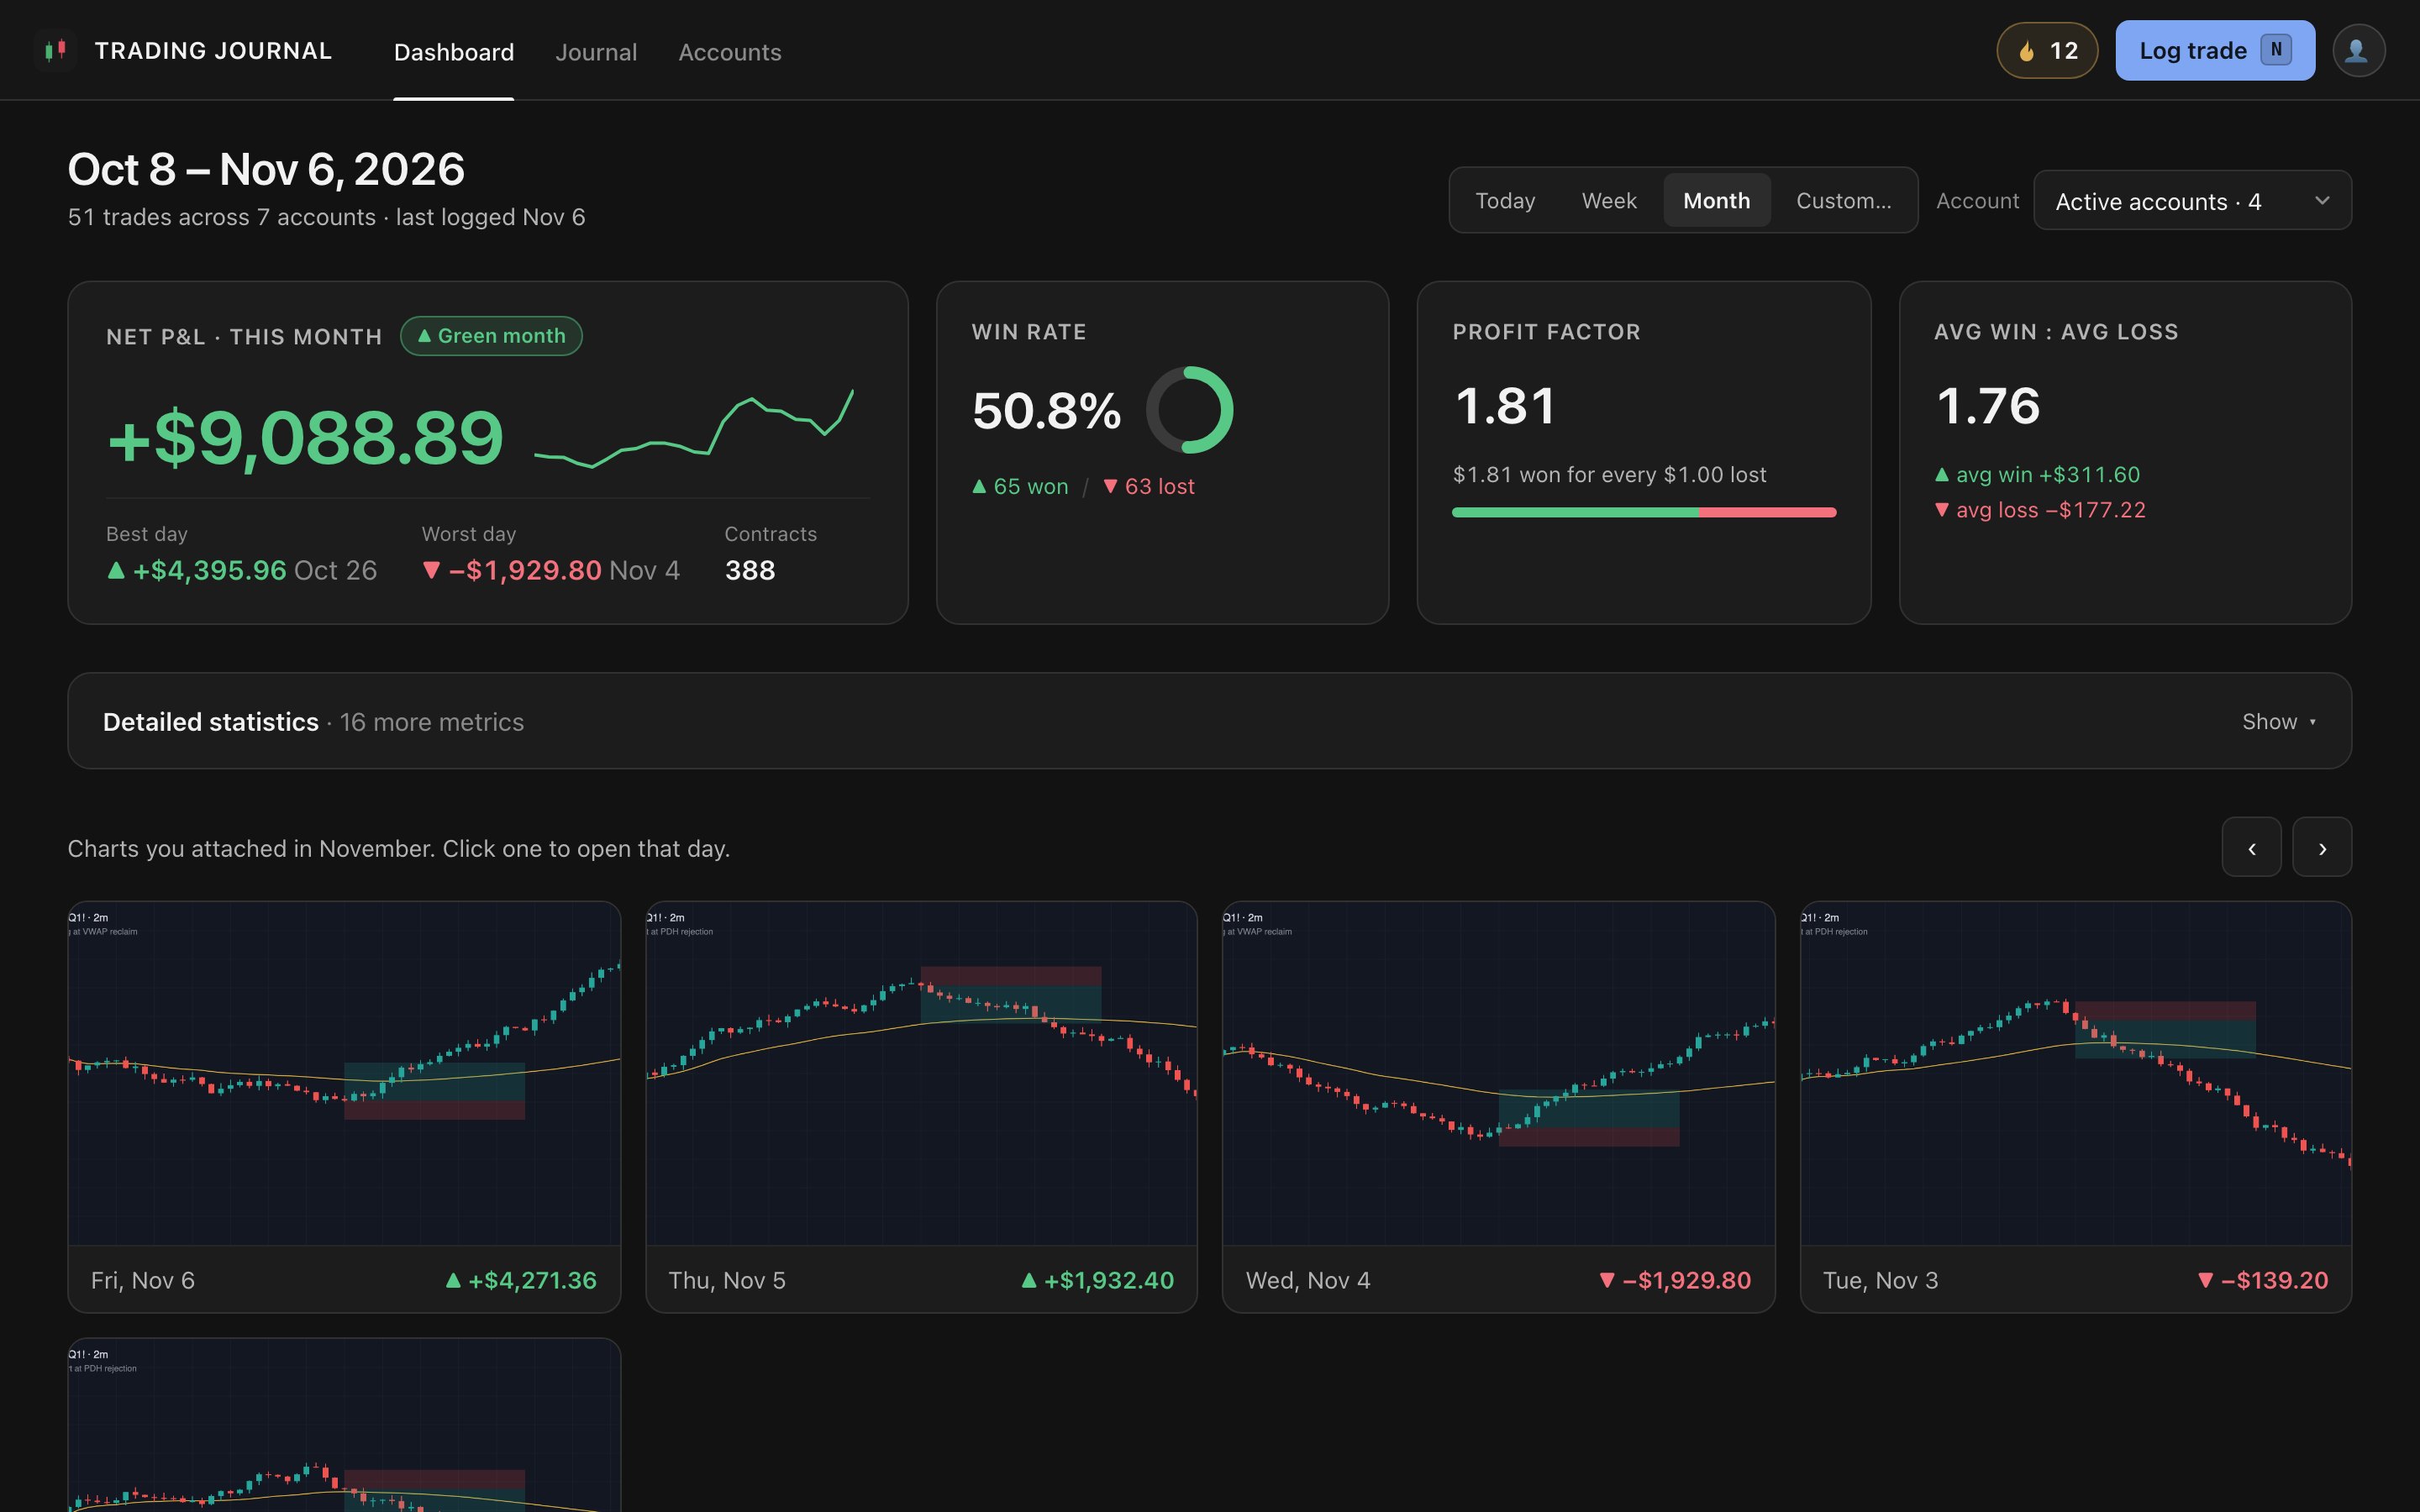
All screenshots use example data.
- Evals, funded and payoutsMoney in versus money out
- Daily rulesA streak for every day you keep them
- Entry checklistProof your setup works
- Journal with chartsPaste screenshots straight in
Accounts
See if prop firms pay you, or you pay them
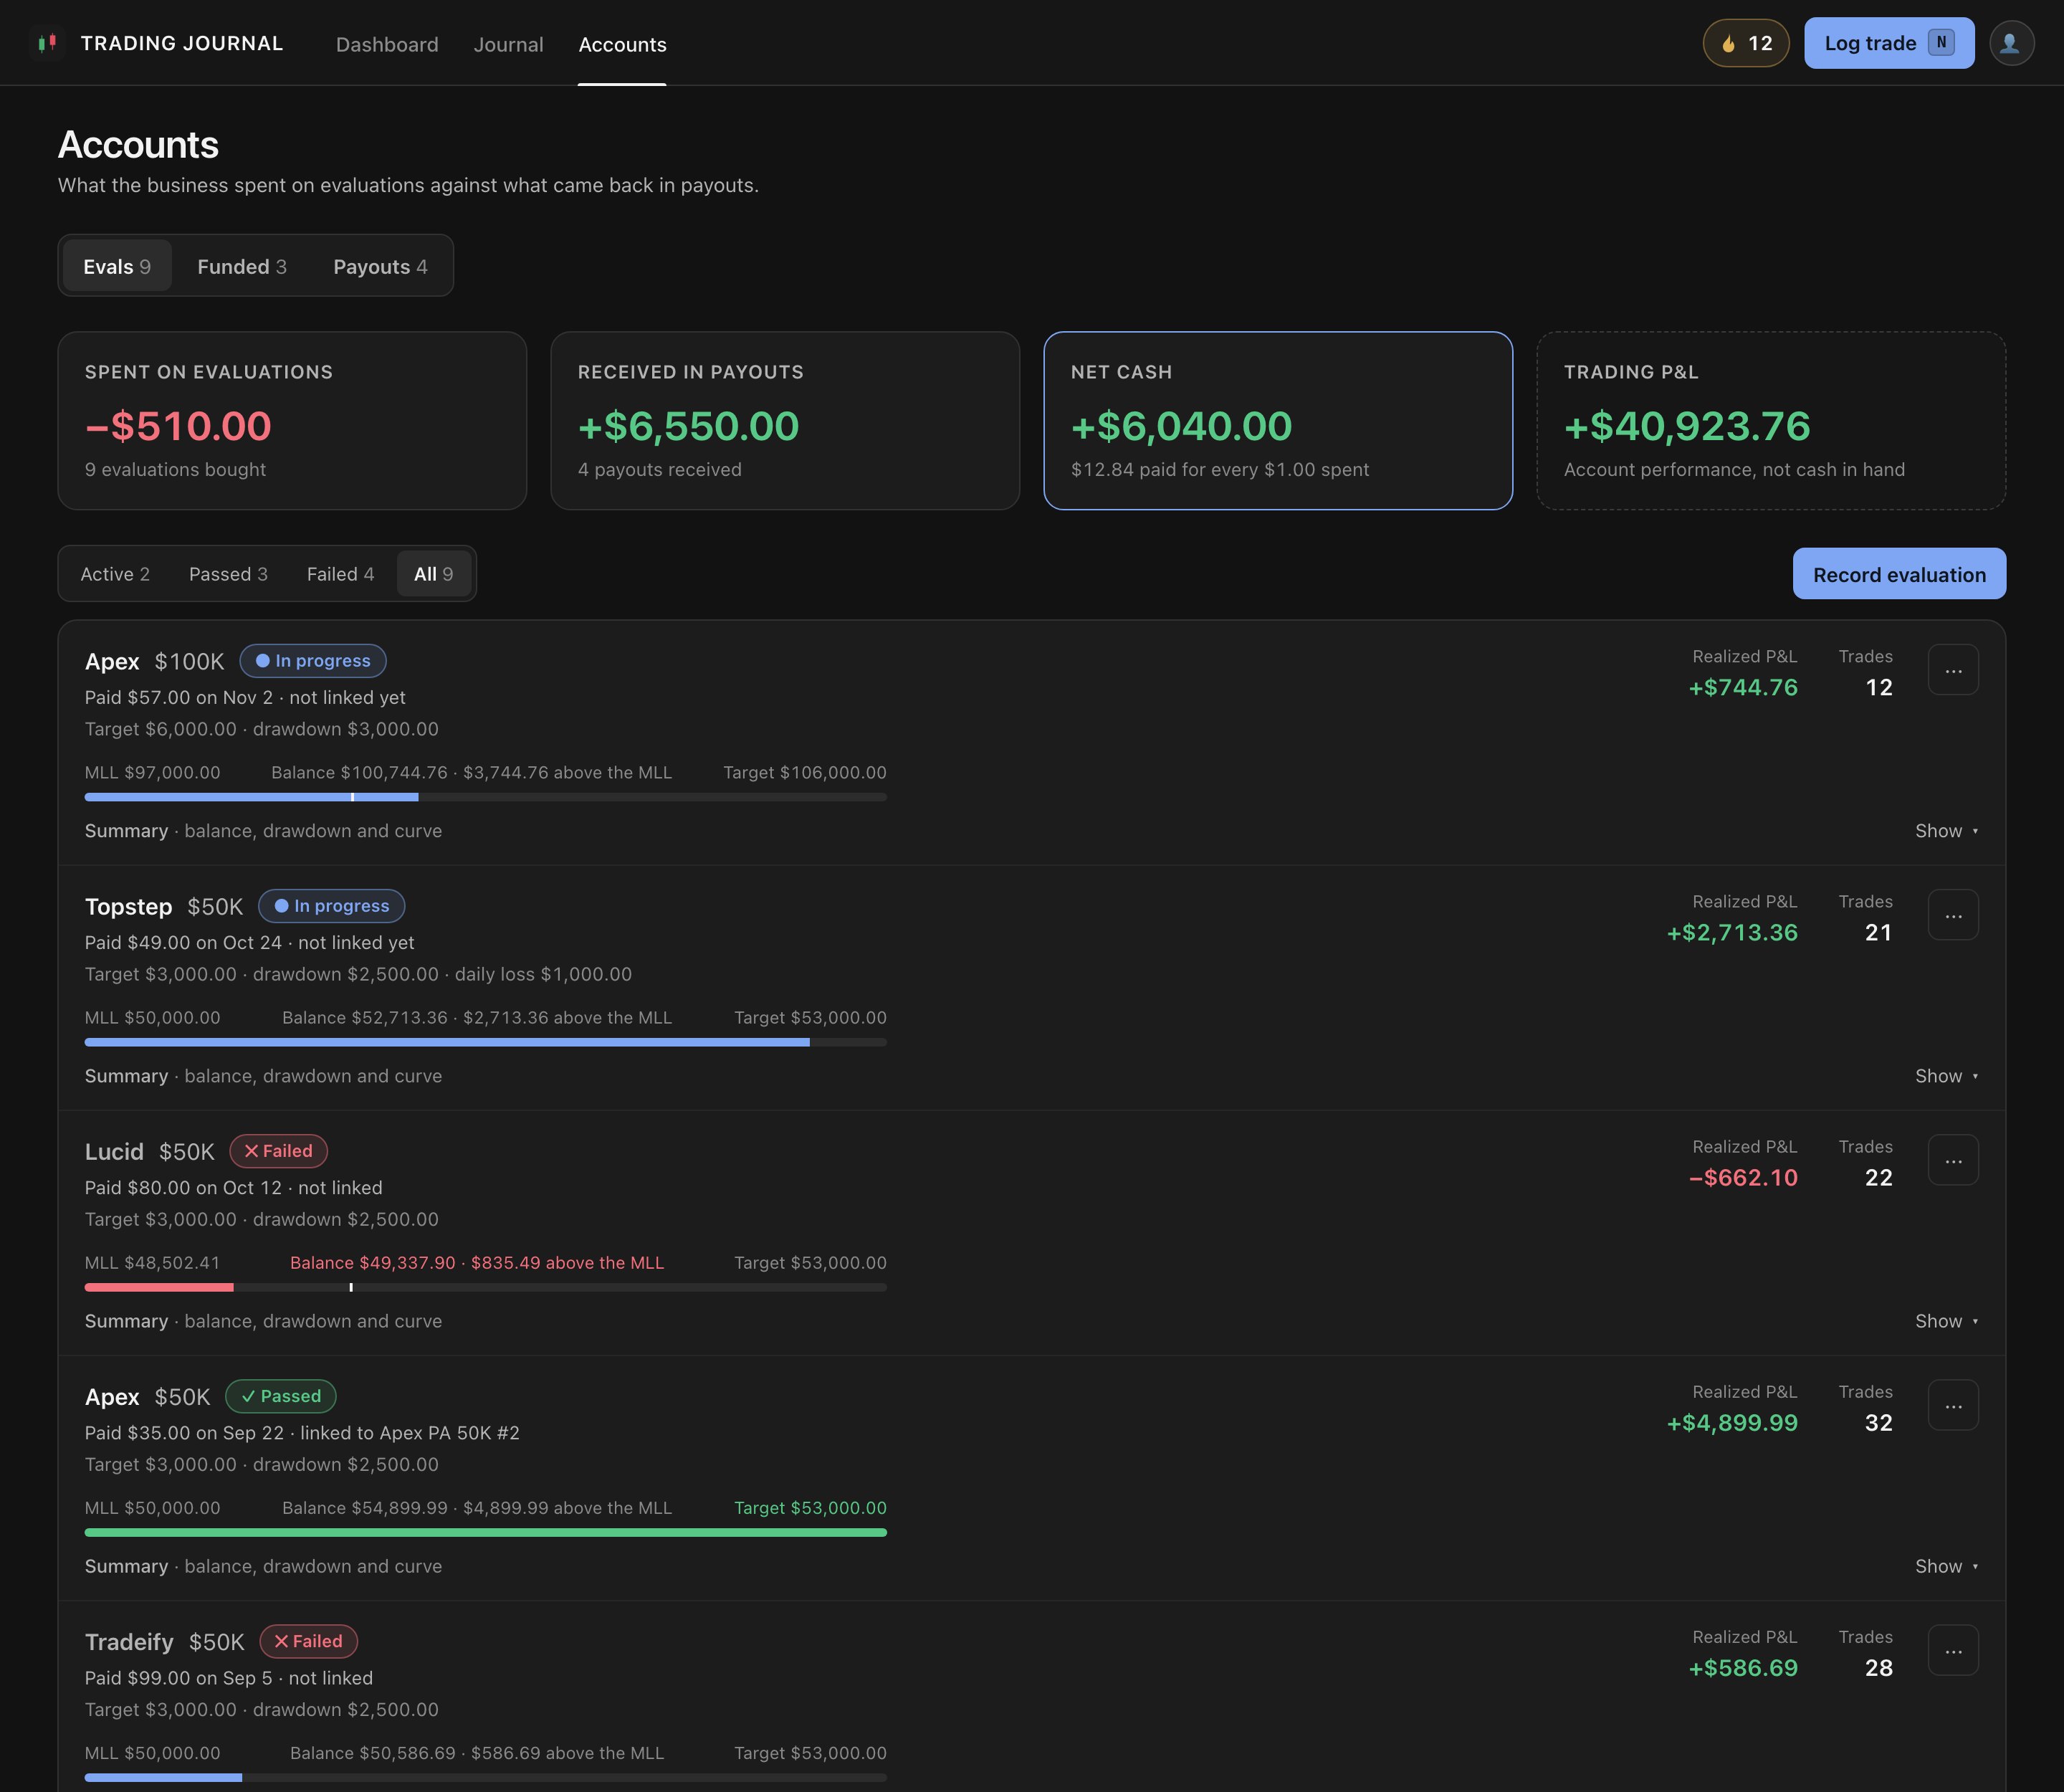
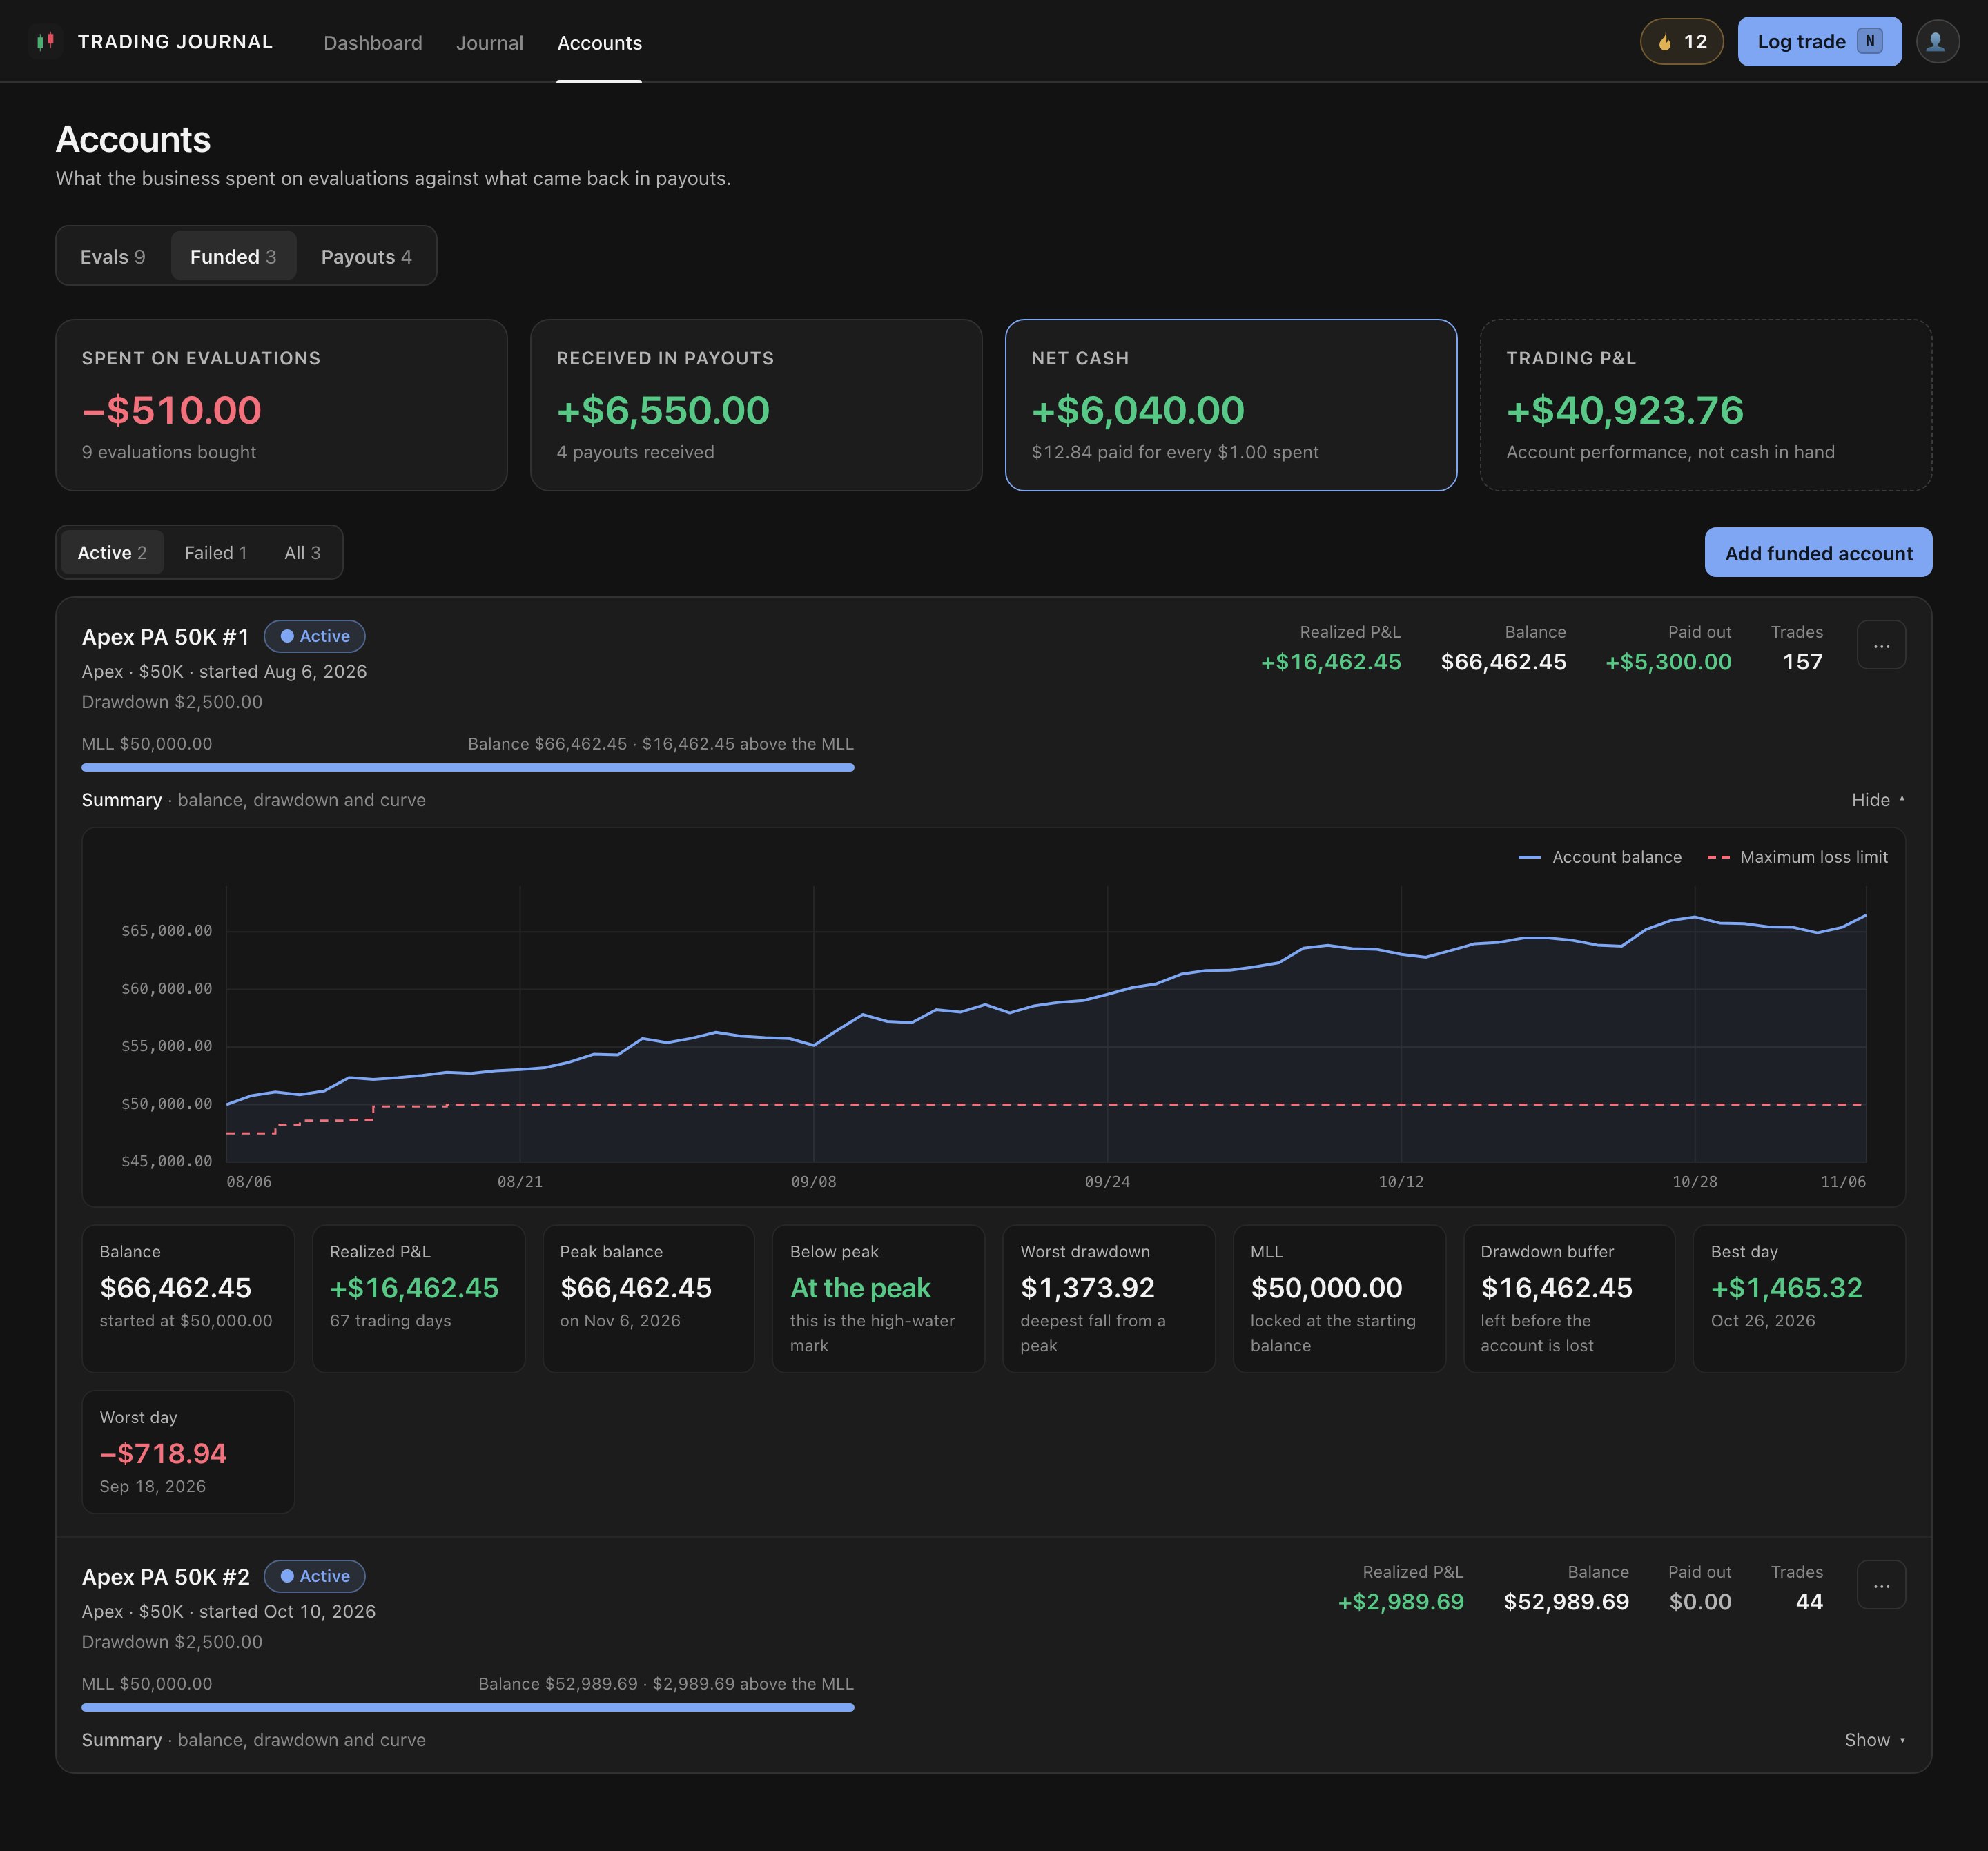
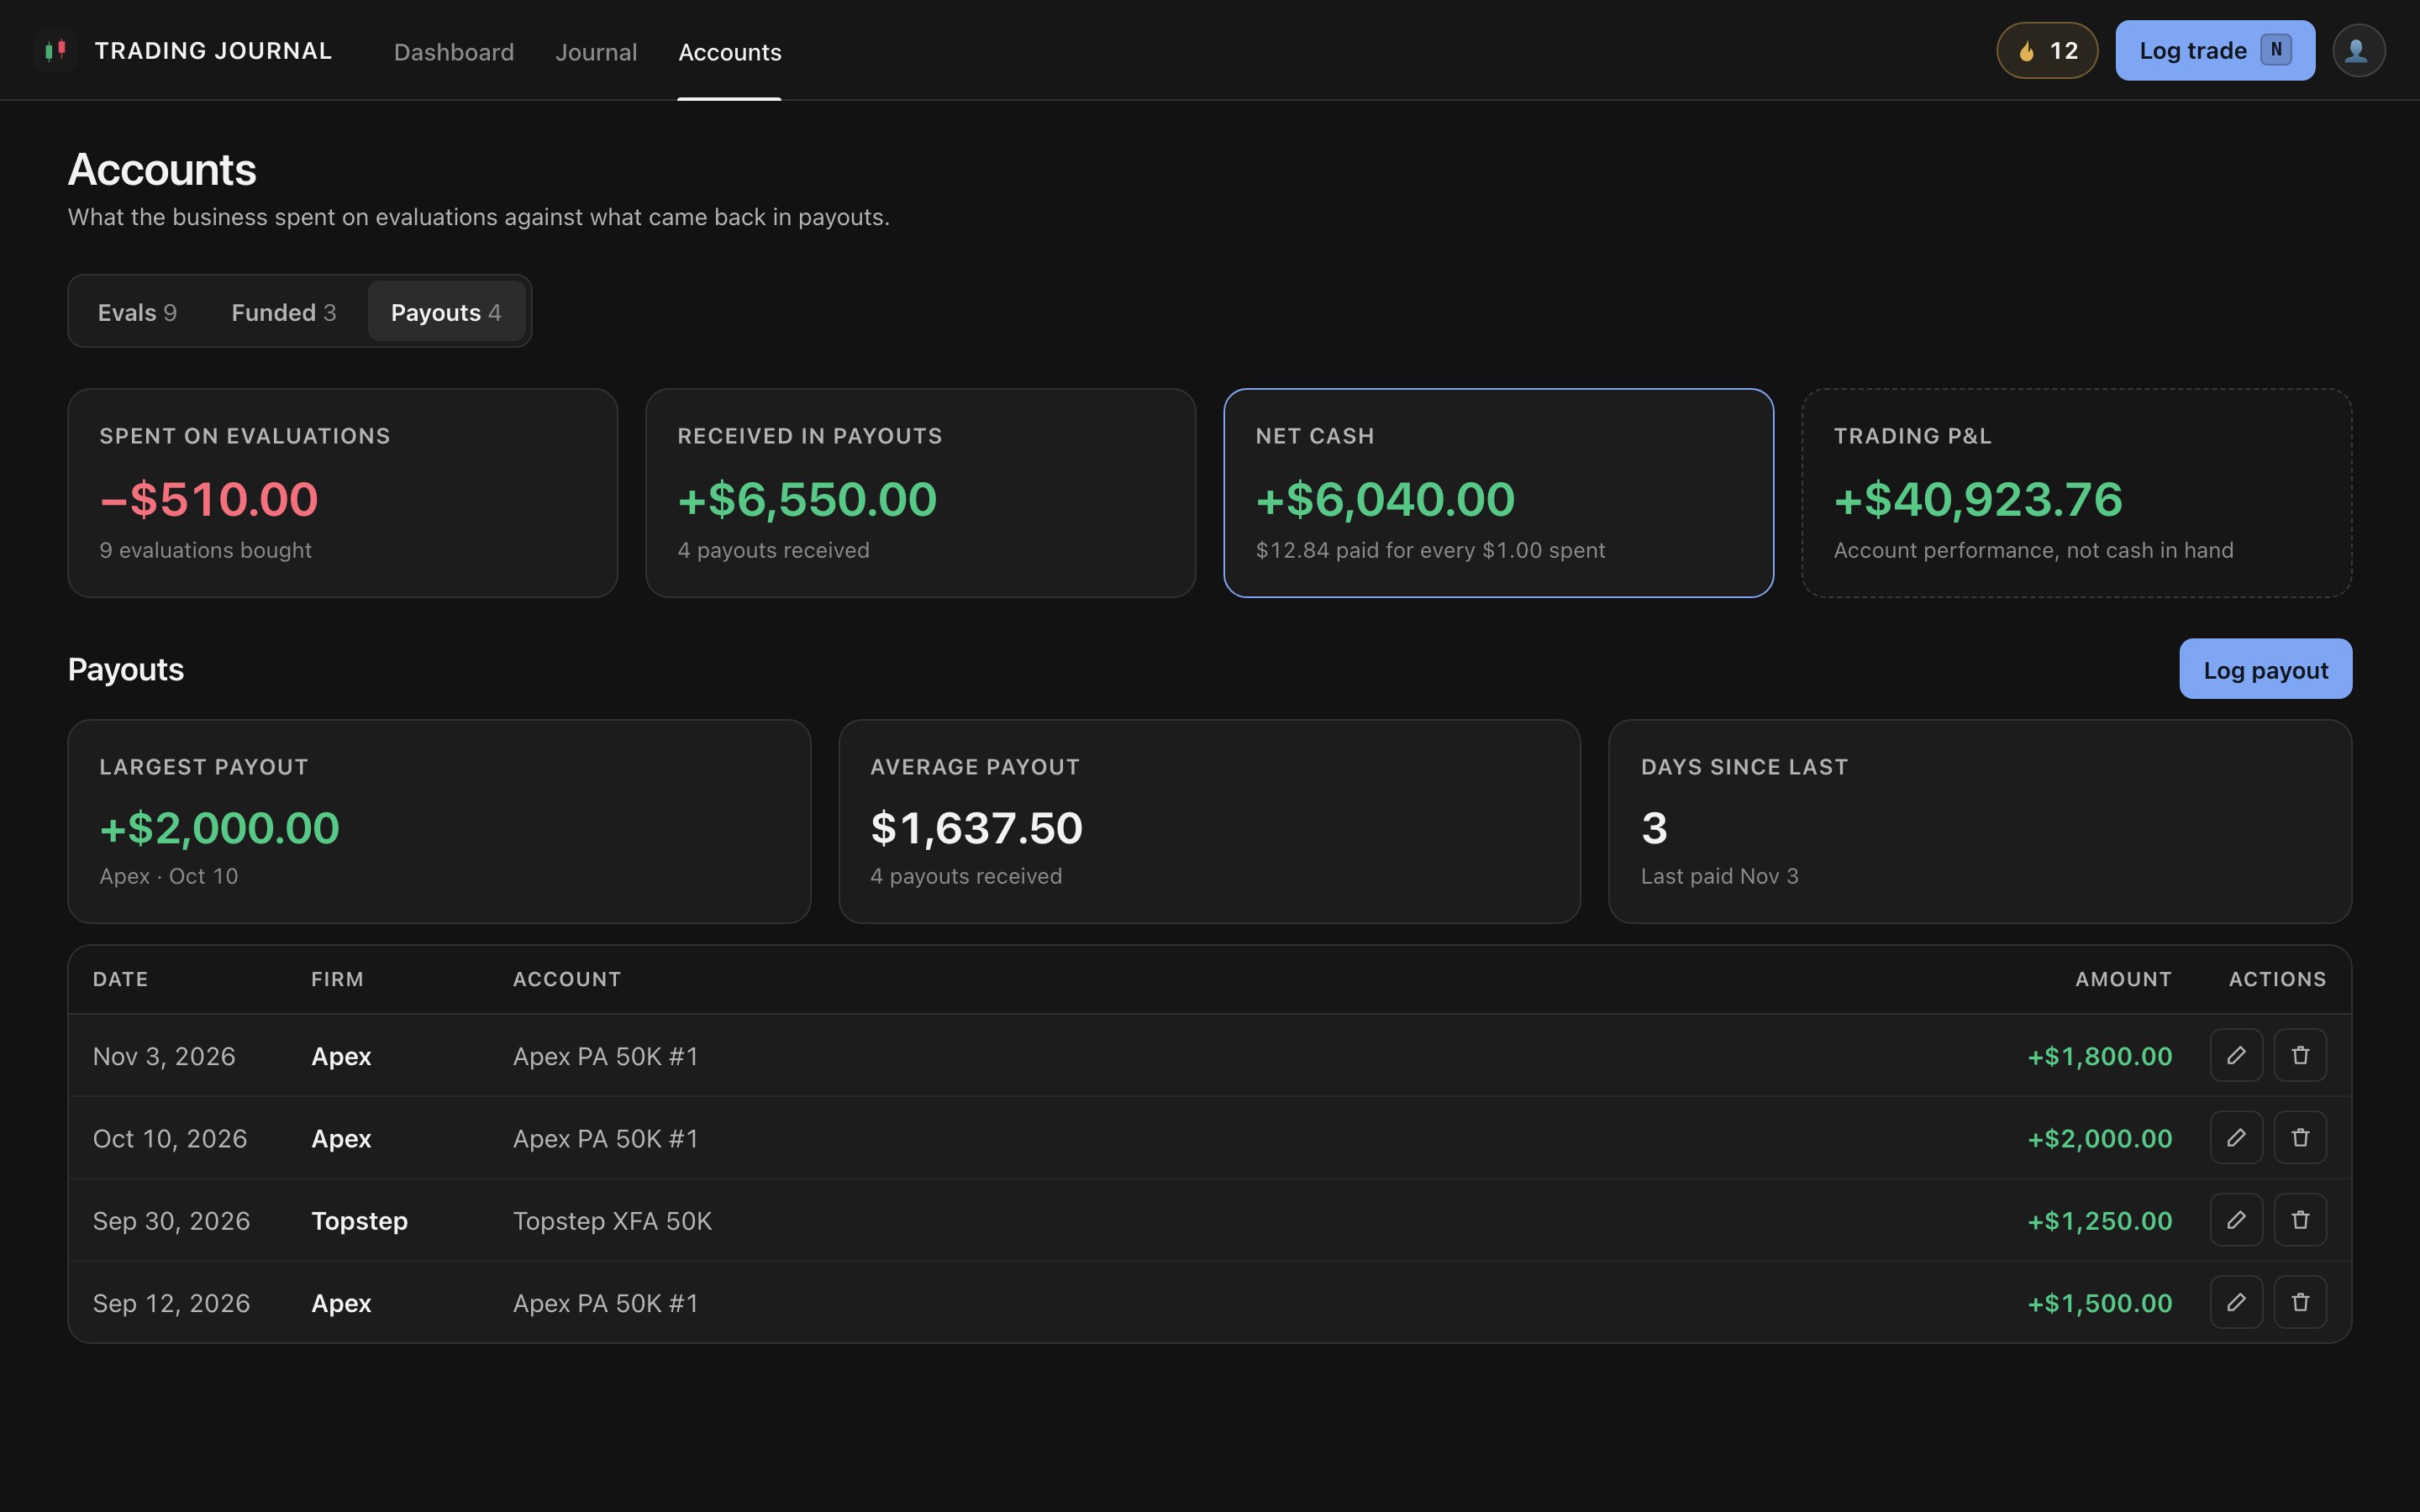
Record every evaluation you buy, mark it passed or failed, and link the funded account it became. Log each payout. The app adds it all up so you always know your real result: cash spent against cash received.
- How many evals you bought, passed and failed, and what they cost
- Every payout, the largest, the average and days since the last one
- Balance, target and maximum loss limit for every account, with a trailing drawdown line
- Templates for the evaluations you buy again and again
Example
9 evaluations bought for $510. 3 passed and became funded accounts. 4 payouts brought in $6,550, so net cash is +$6,040: $12.84 back for every $1 spent.
Daily rules
Write your rules once. Check them off every day.
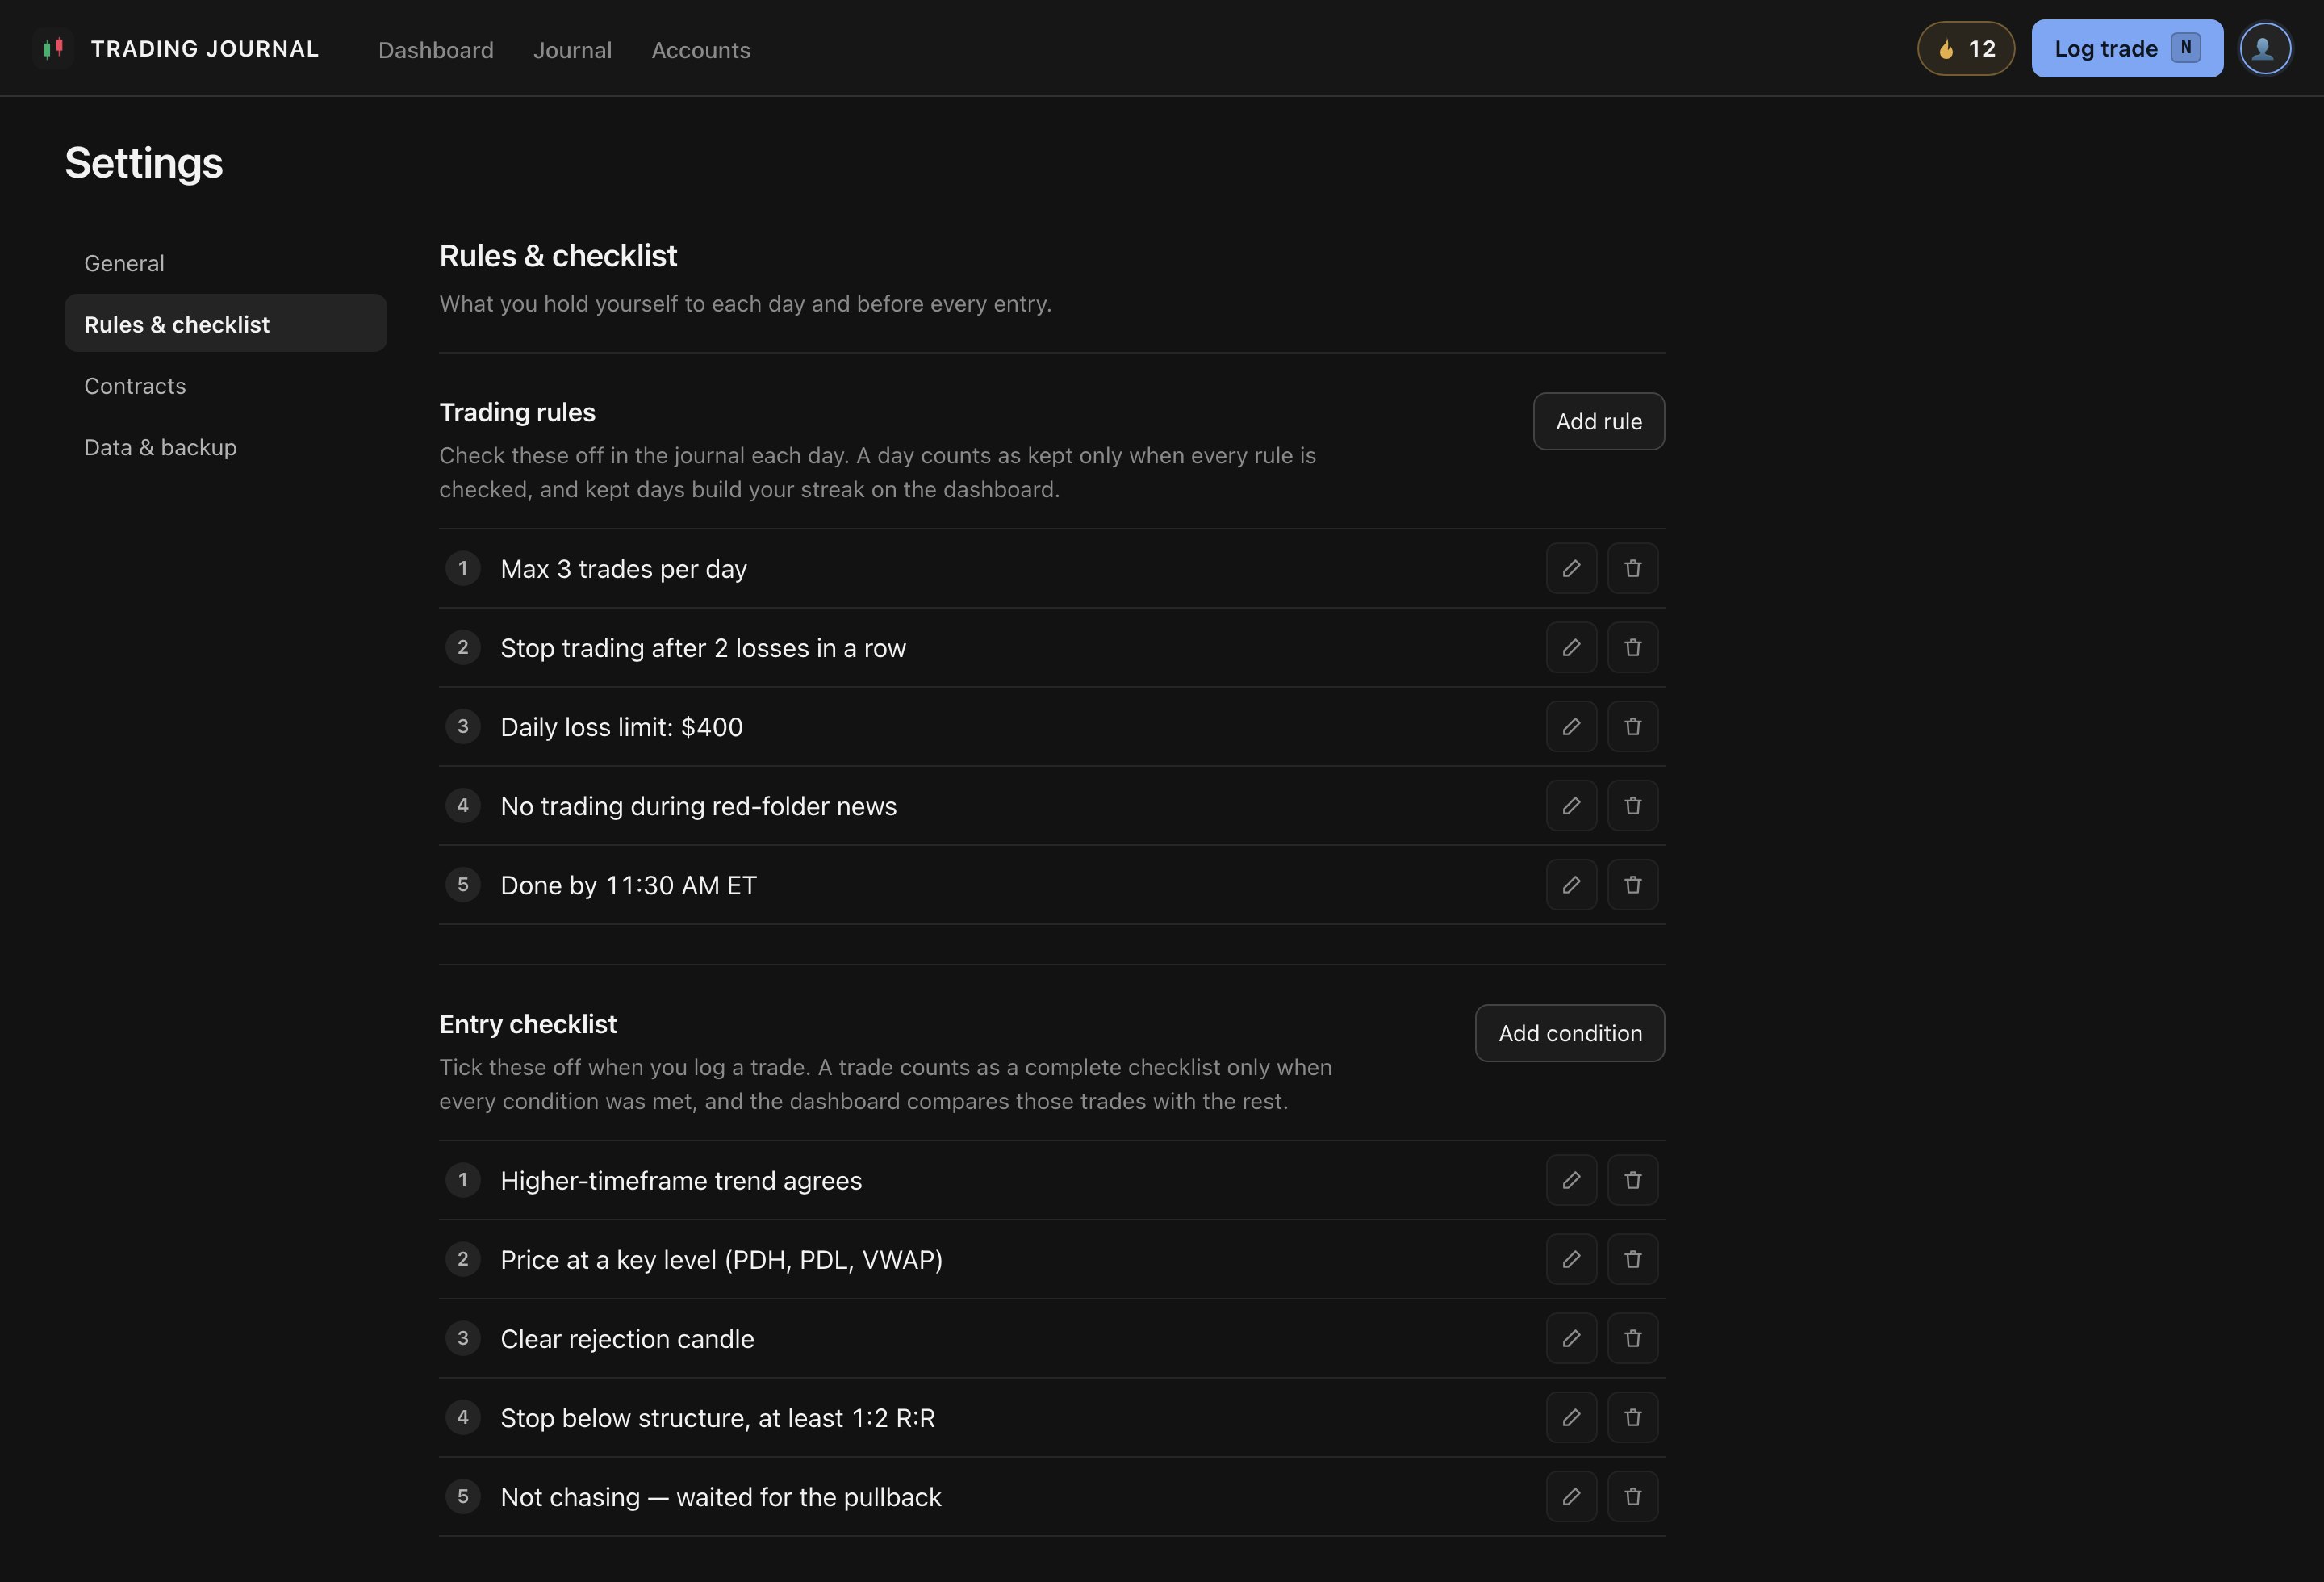
Add the rules you trade by. Each day, tick them off in the journal. A day counts as kept only when every rule is checked, and kept days build a streak you see in the top bar and on the dashboard.
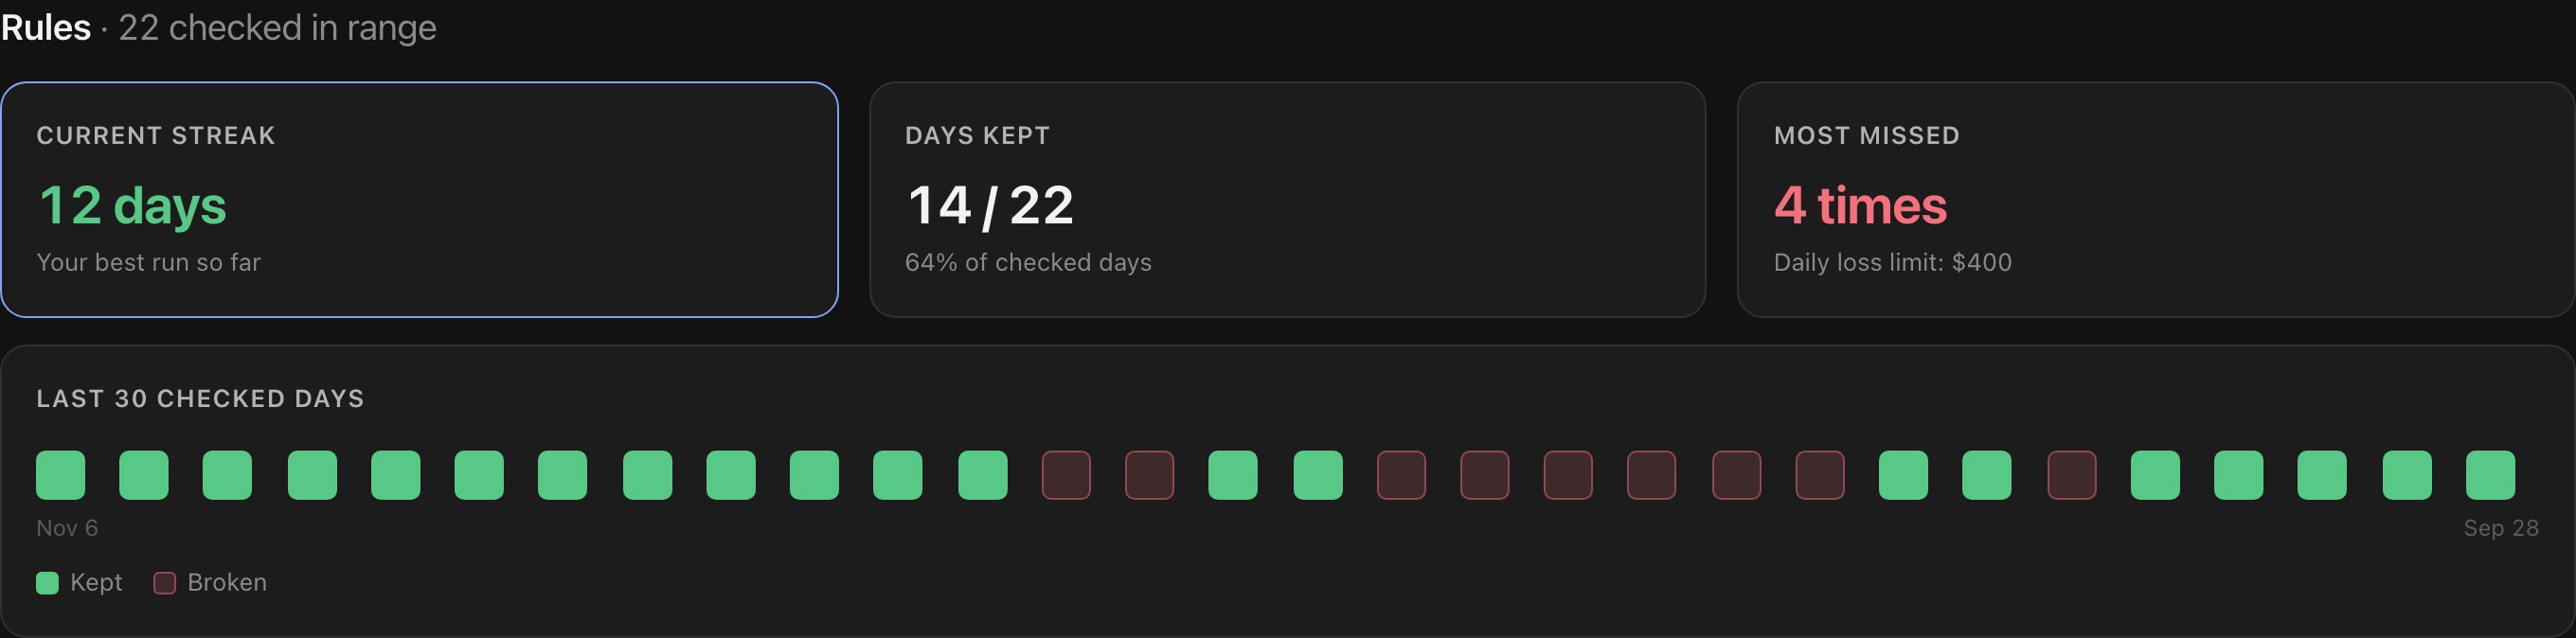
- Your current streak and your best one
- How many days you kept your rules in any date range
- The rule you break the most, so you know what to work on
- A timeline of the last 30 checked days, one square per day
Example rules
- Max 3 trades per day
- Stop trading after 2 losses in a row
- Daily loss limit: $400
- No trading during red-folder news
- Done by 11:30 AM ET
Result: a 12-day streak, 14 of 22 days kept this month, and “Daily loss limit” is the most missed rule (4 times).
Entry checklist
Know if your setup works, with numbers
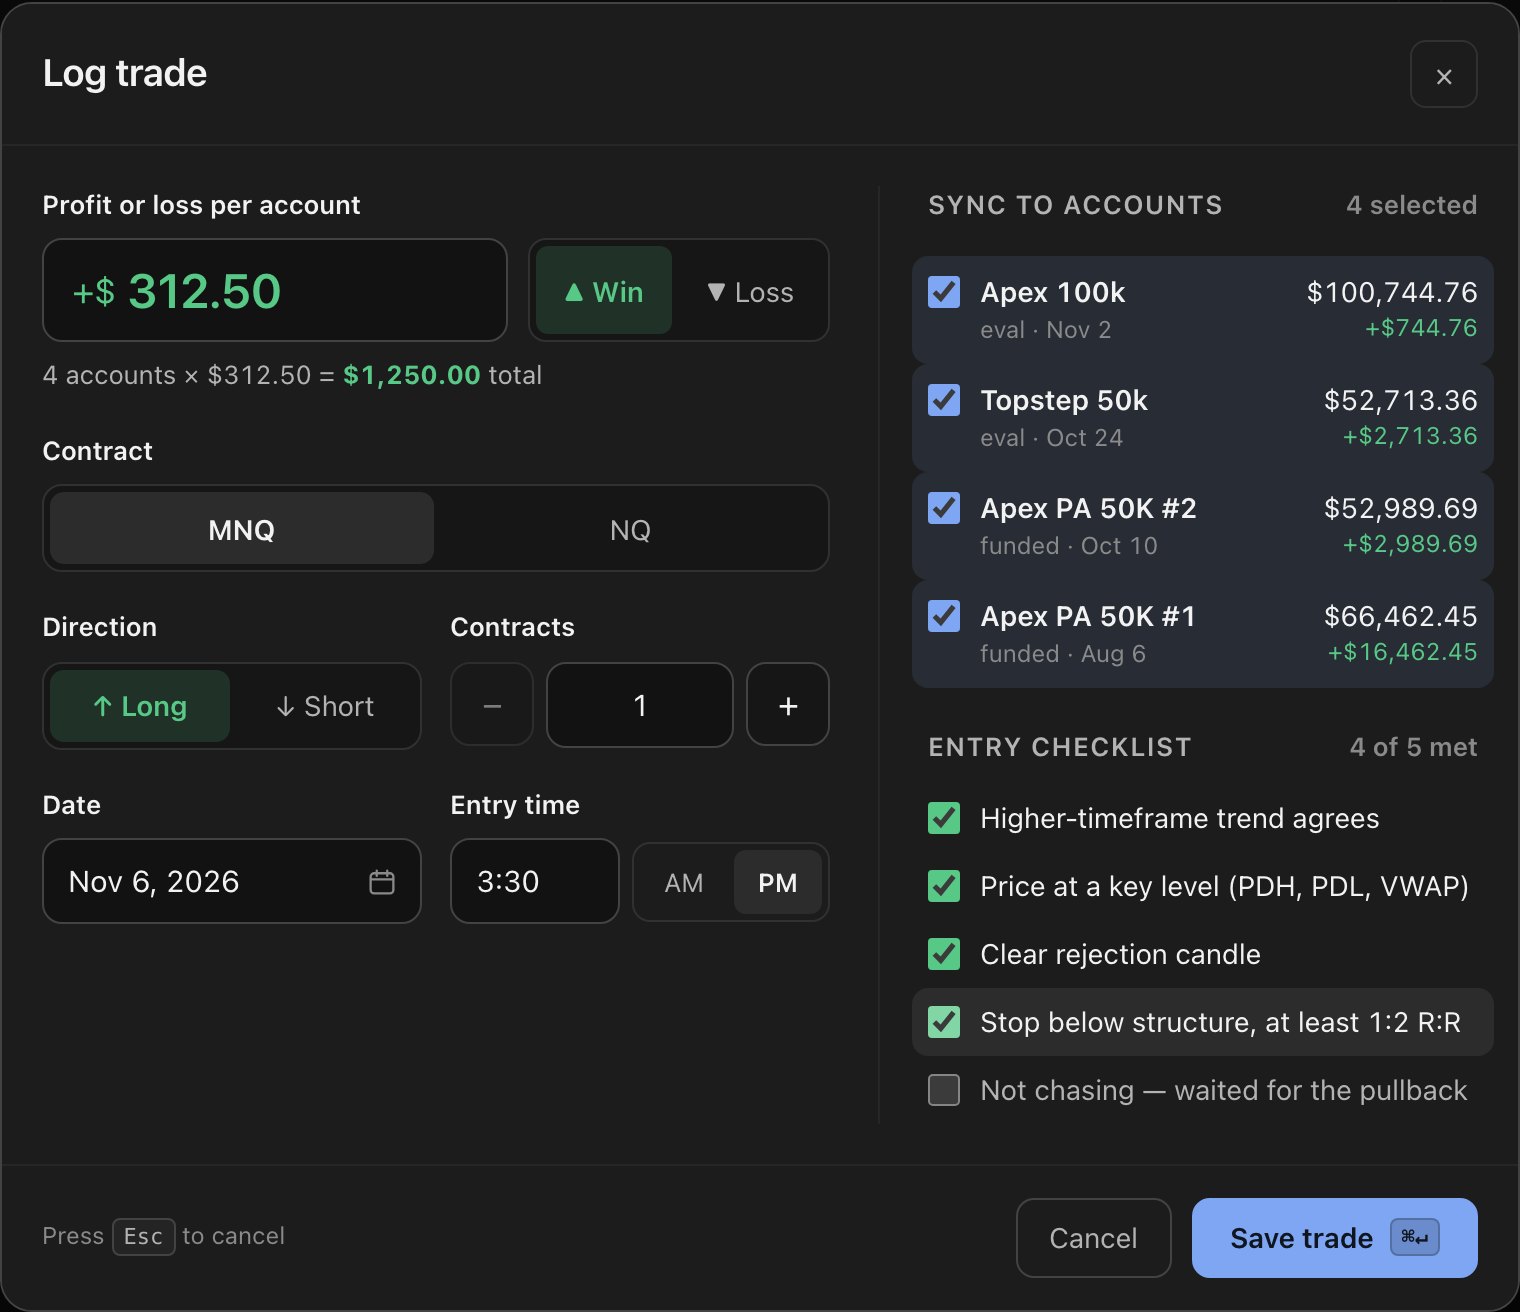
Write the conditions you want before every entry. When you log a trade, tick the ones that were there. The dashboard then compares trades with the full checklist against trades where you skipped something.
- Win rate and P&L with the full checklist versus missed conditions
- Log a trade once and sync it to every account you copy it to
- Profit or loss per account, contract, direction, size and entry time
- Press N anywhere to log a trade
Example
Skipping the checklist cost this trader money. Now there is proof.
Journal
Everything about your day, on one page
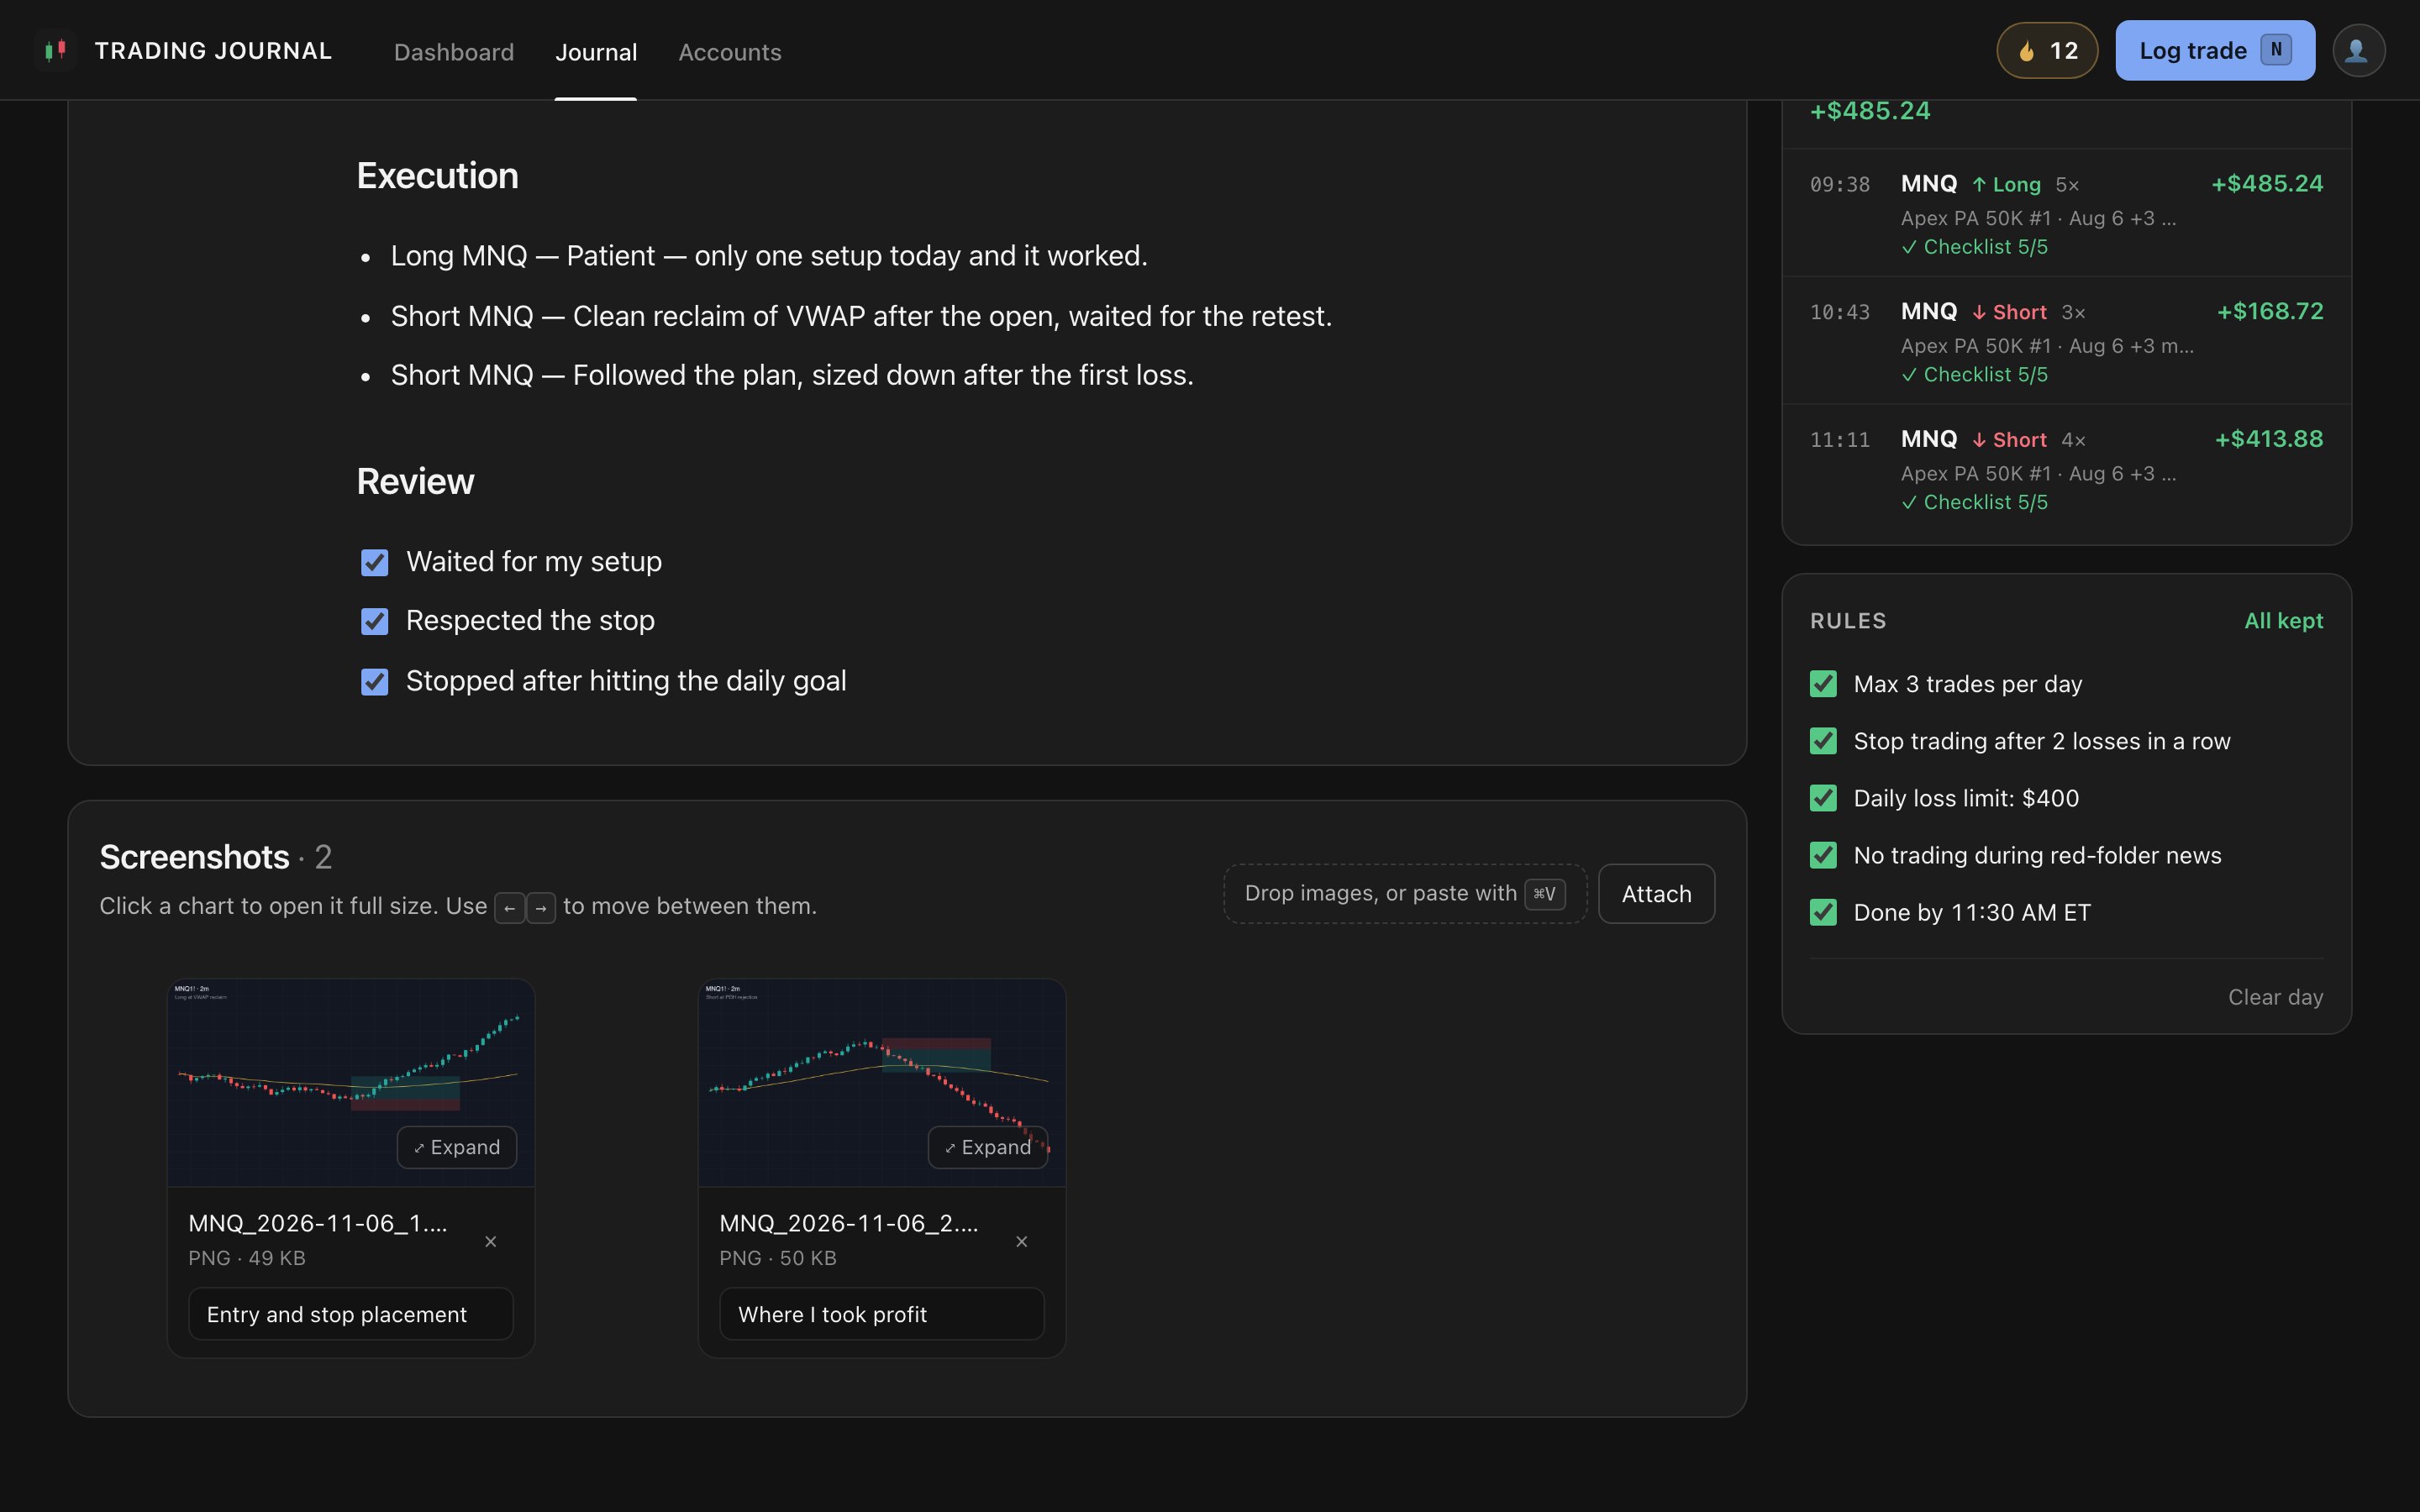
Each day has its own page: your notes, that day's trades and results, your rules to check off and the charts you took. Move between days with the arrow keys. Everything saves on its own.
- Headings, lists, to-dos and quotes, plus a template for your daily routine
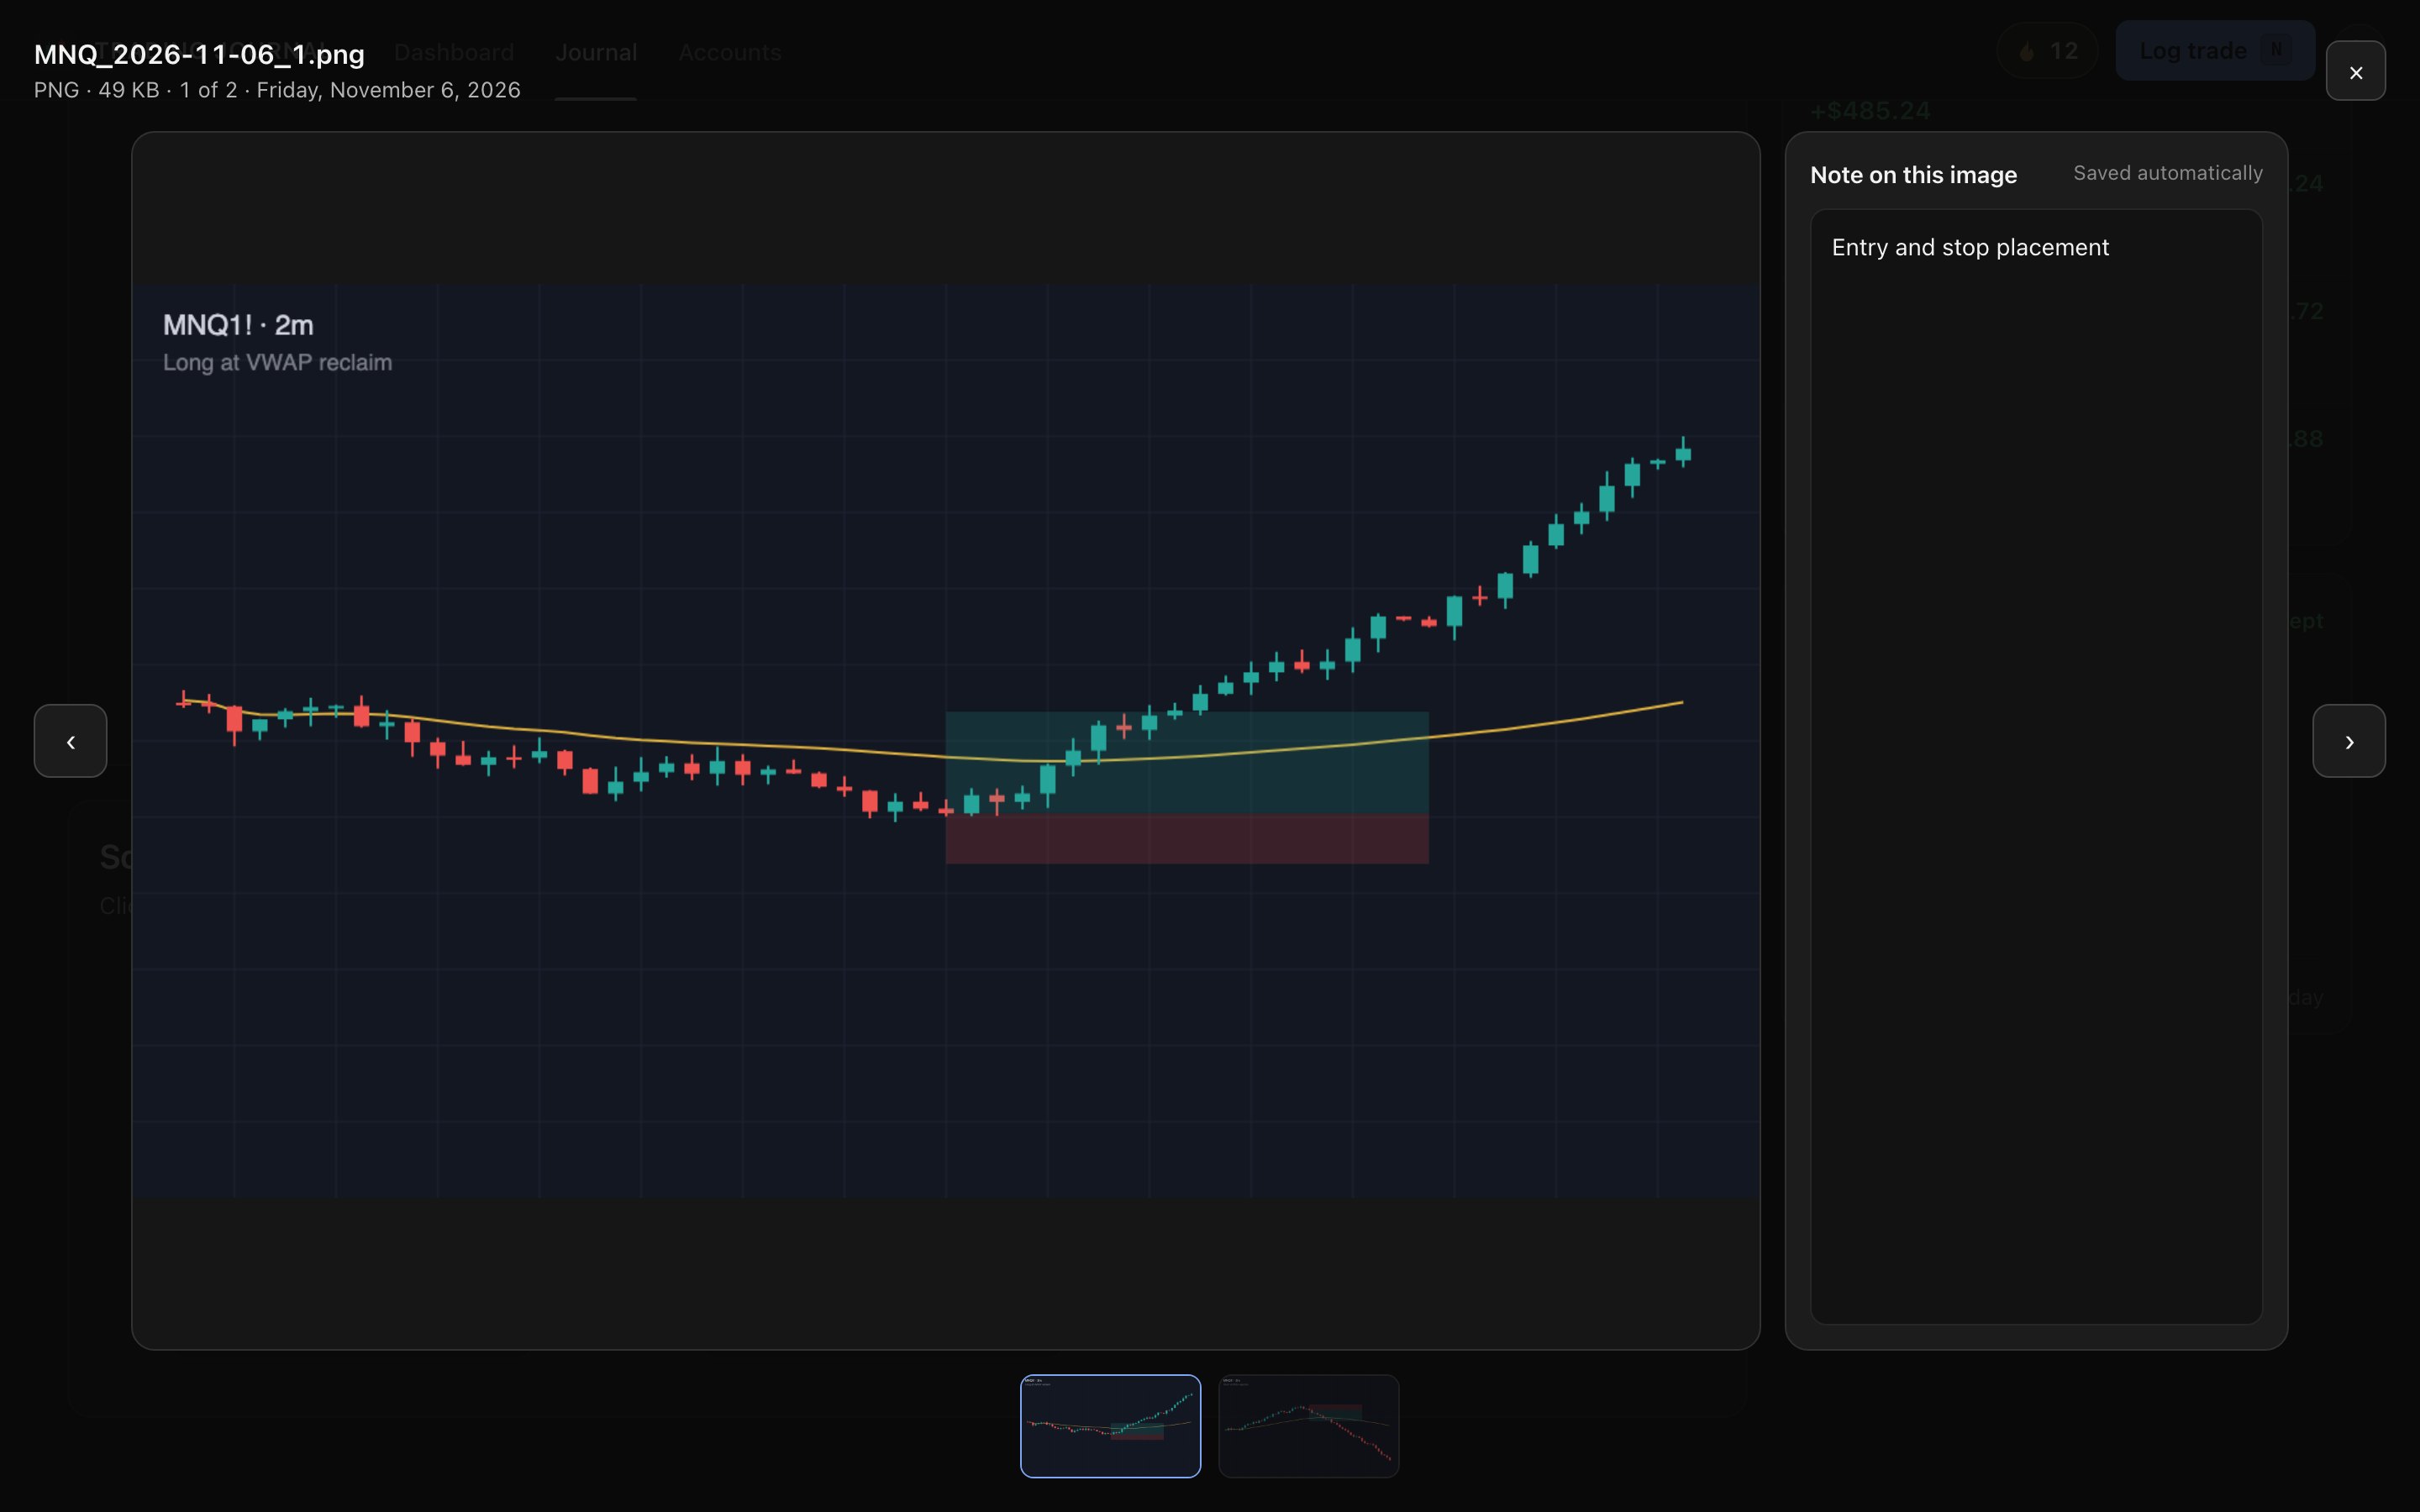
- Paste a screenshot with ⌘V or drag it in, and add a note to each one
- Open charts full size and flip through them with the arrow keys
- The day's trades, win rate and checklist score next to your notes
Example day
Pre-market bias and levels, three trades with what happened in each, a short review, two charts (“Entry and stop placement”, “Where I took profit”) and all 5 rules kept.
Statistics
The numbers that tell you what to fix
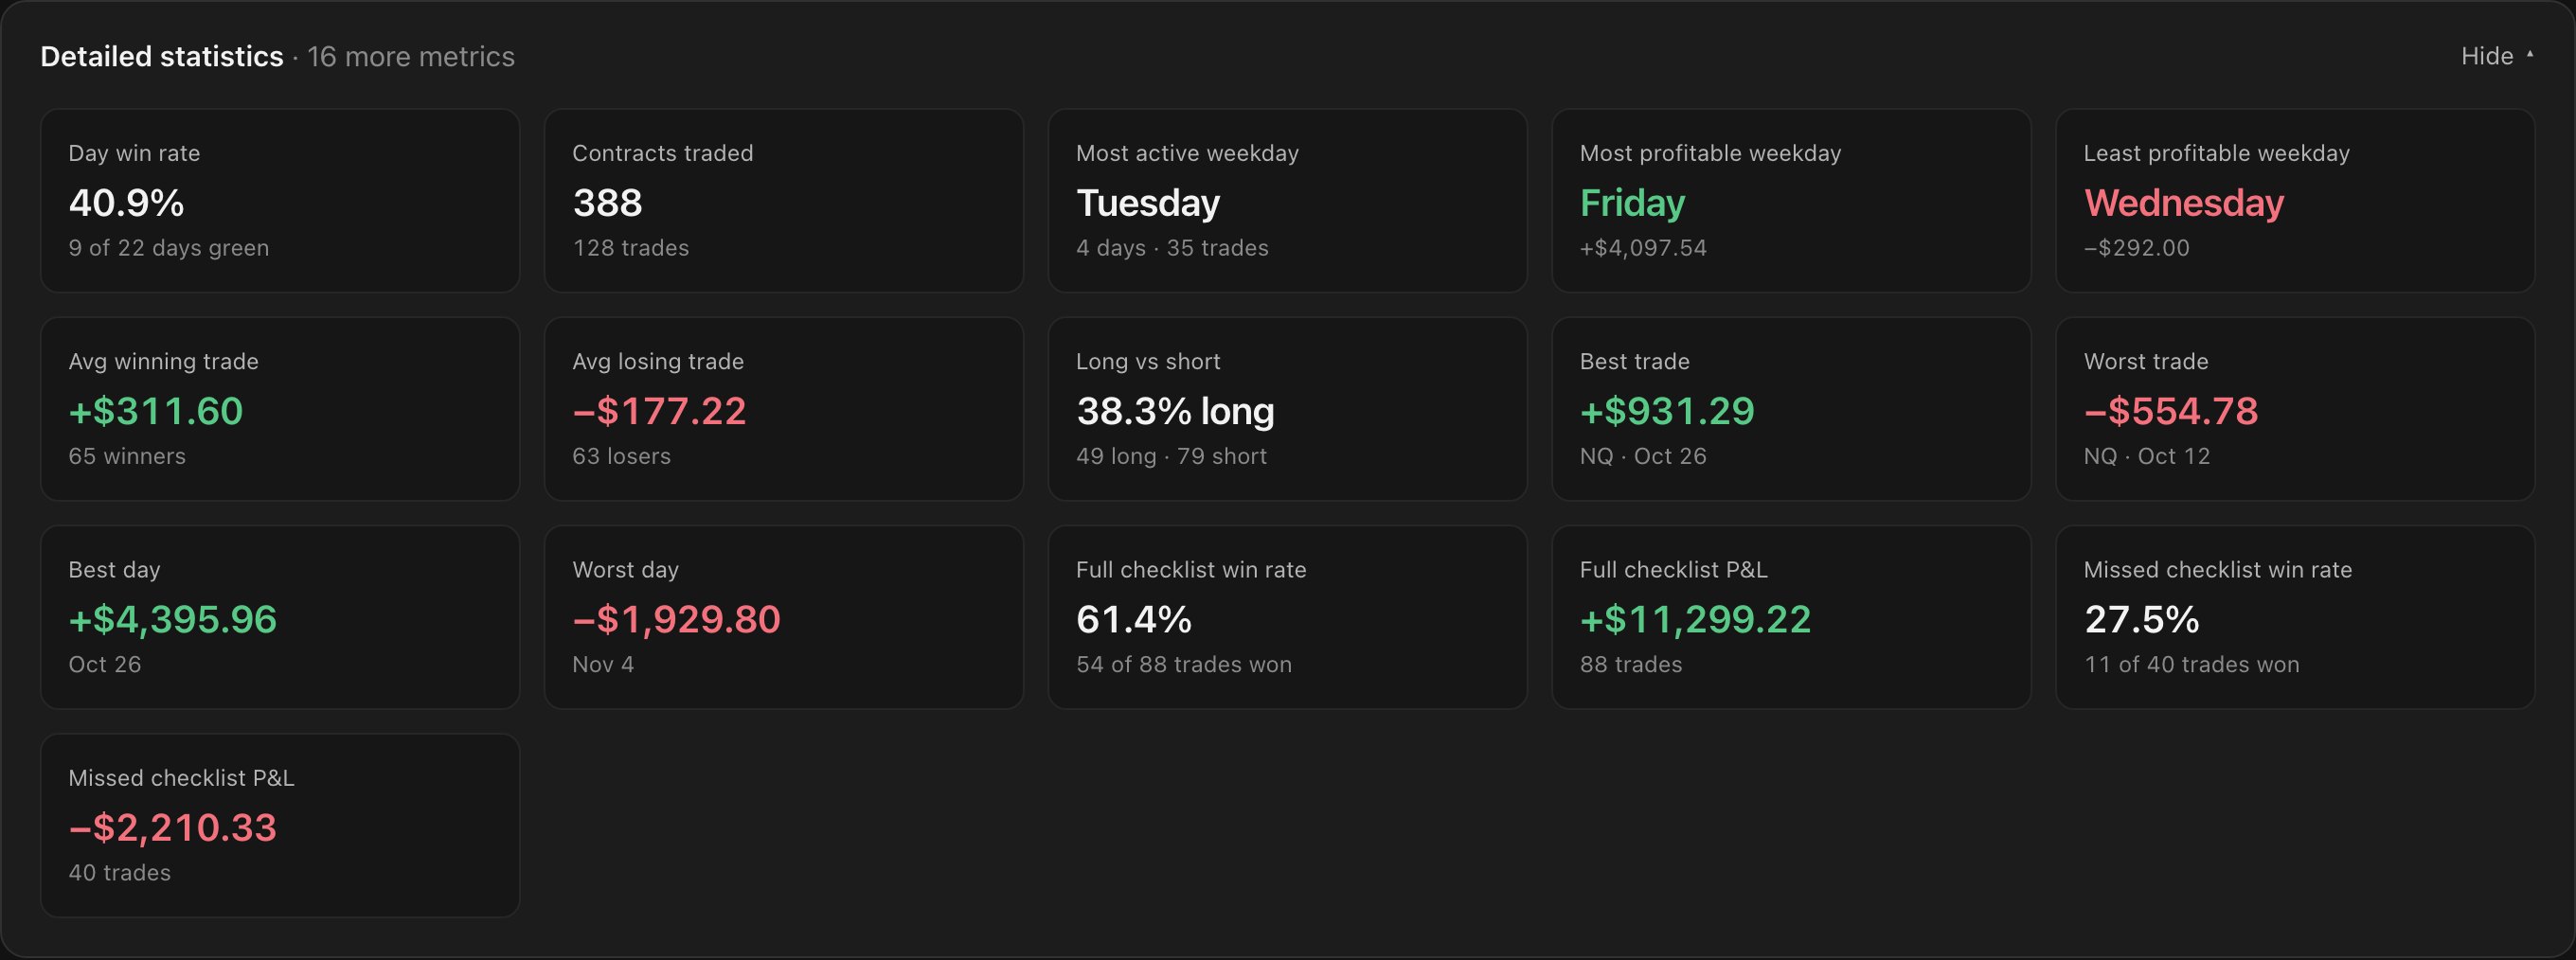
Filter by today, this week, this month or any dates, and by account. The dashboard shows net P&L, win rate, profit factor and average win against average loss, with 16 more metrics one click away.
- Best and worst day, best and worst trade
- Most and least profitable weekday
- Day win rate and long versus short
- Checklist win rate and P&L
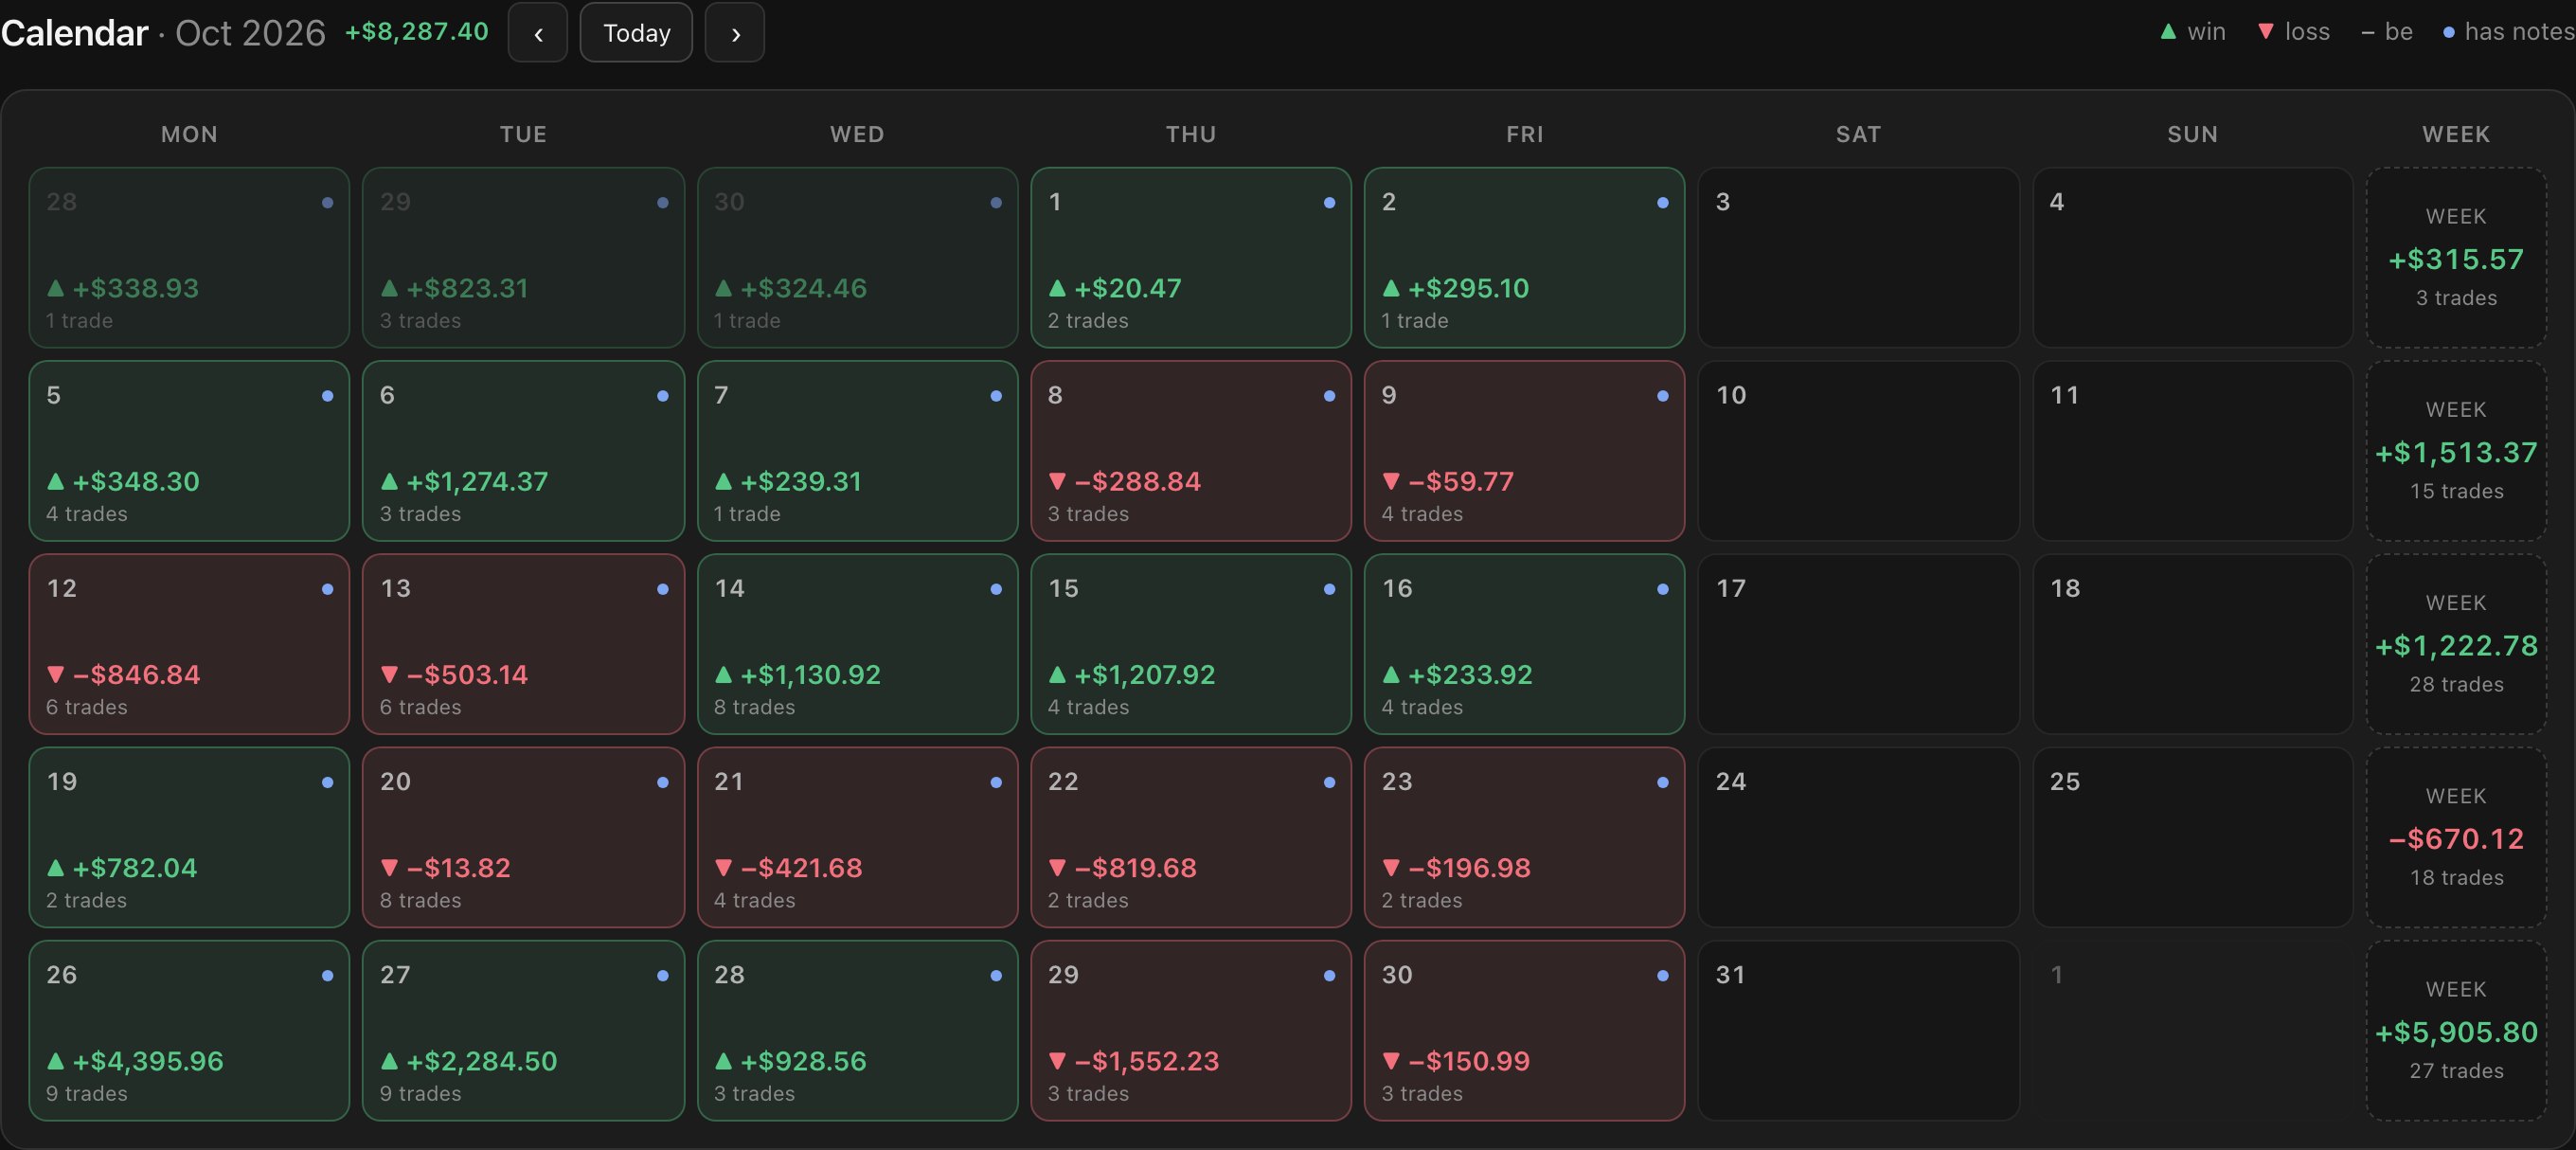
- A calendar with each day's result and weekly totals
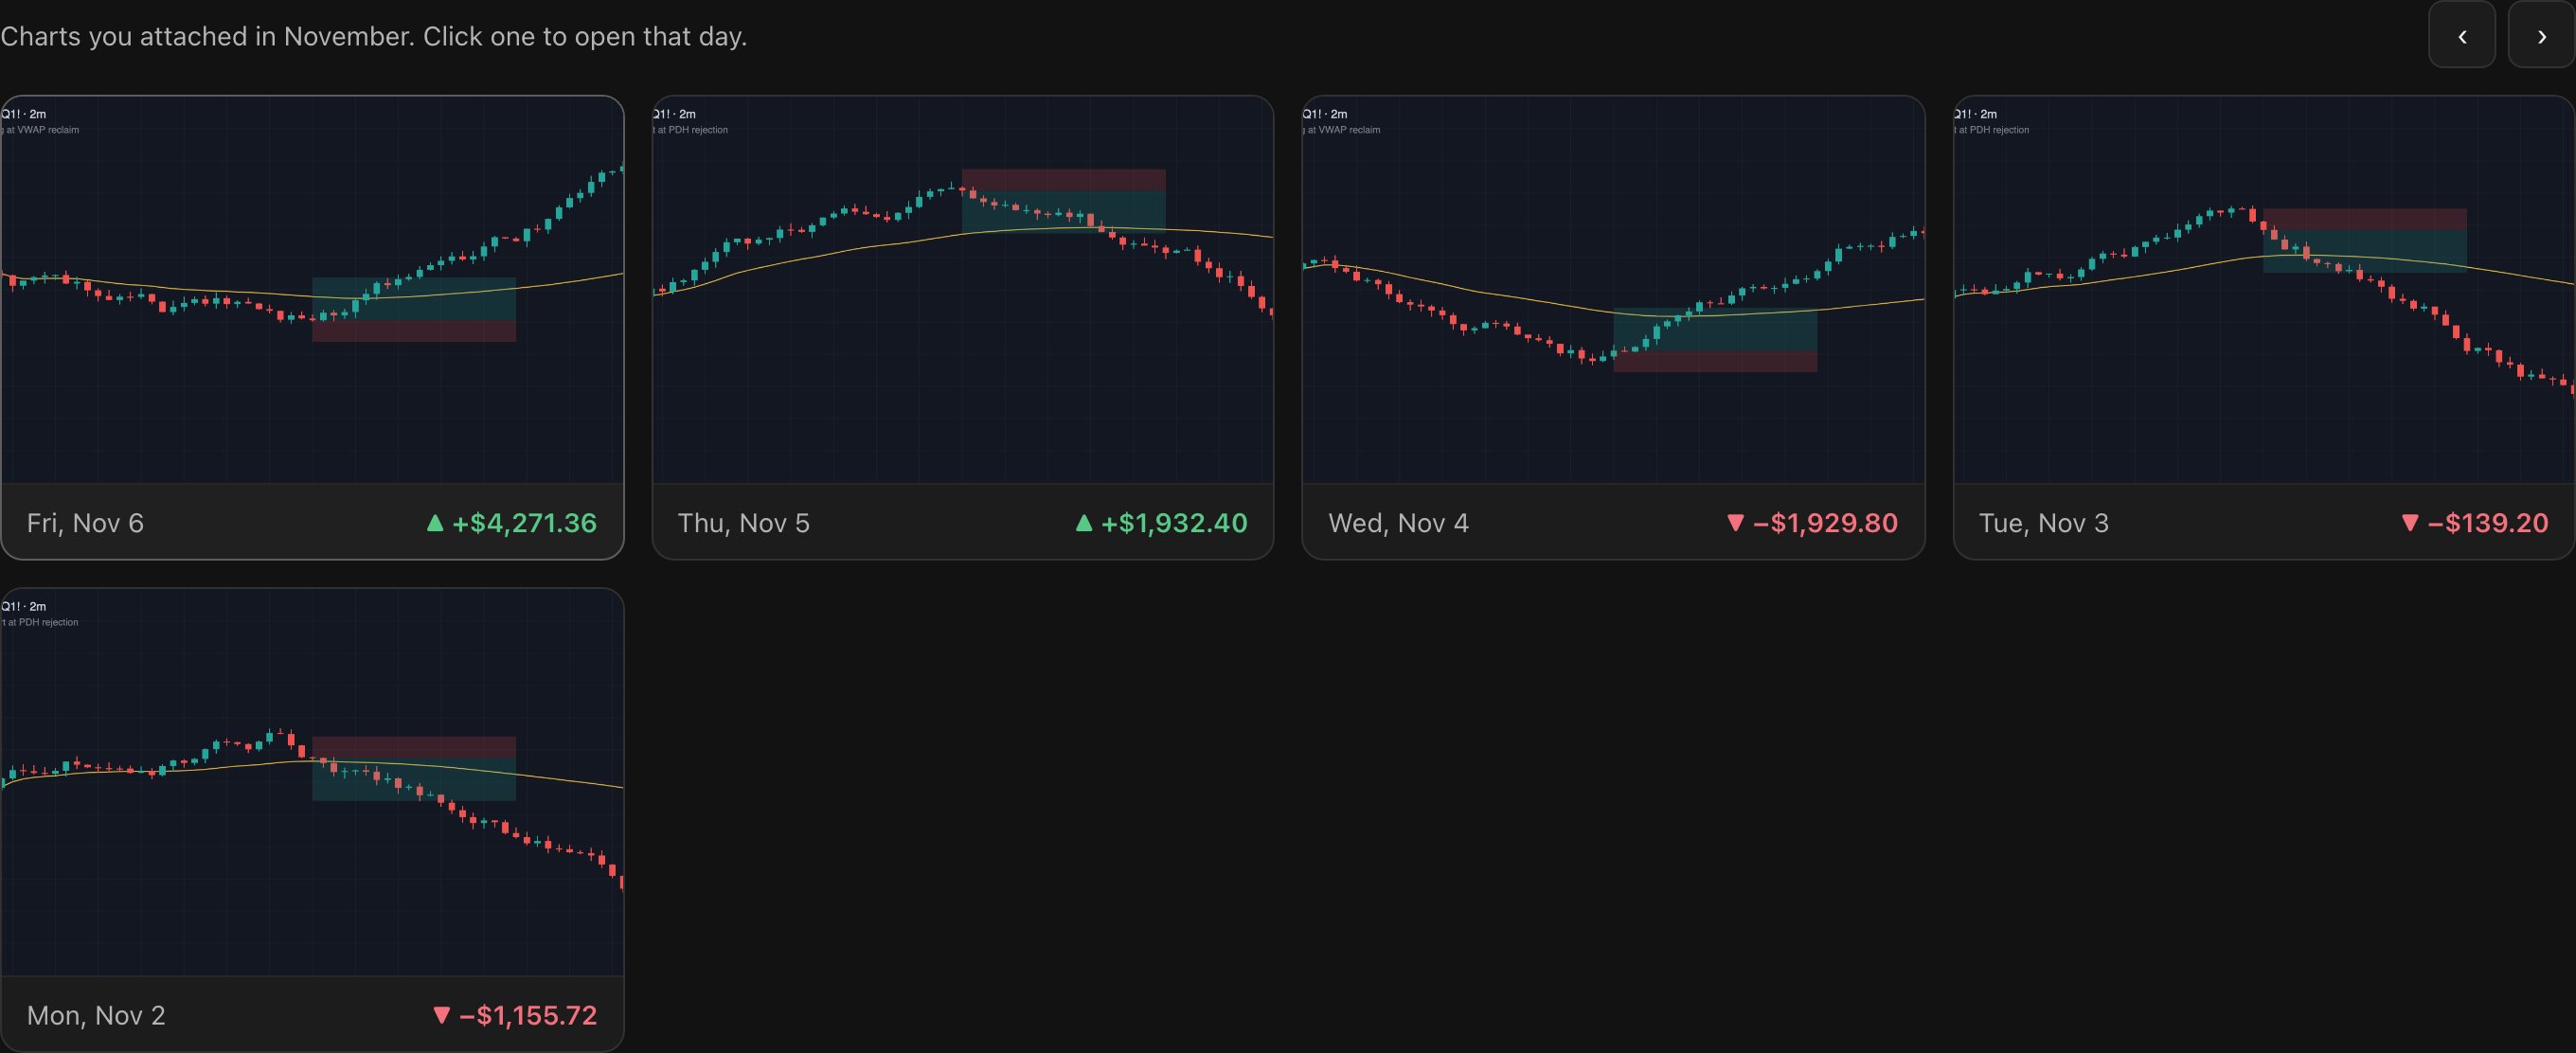
- Every chart you attached this month, one click from its day
Your data stays with you
Everything is saved on your computer. No account, no cloud. Export a full backup, screenshots included, whenever you want.
Updates in one click
The app checks for new versions when it opens. Your journal, trades and screenshots are kept.
Windows and macOS
Windows 10 and 11, and Macs with Apple Silicon or Intel.
Start tracking today
Free download. Set up your rules and checklist in a couple of minutes.
Download Trading Journal